Research Overview
Data analysis can be complicated, and communicating the process of data analysis can be difficult. The complexity in human analytic processing can make it difficult to remember the steps and rationale that led to the formation of hypotheses, the generation of specific data views, and the realization of conclusions. Our research explores new designs for visually representing the history of data analysis and evaluating the effectiveness of different designs. Effective presentation and communication of analytic processes is essential for understanding the underlying arguments behind decisions, and visual presentation will facilitate review of analysis processes by making it possible to understand analytics strategies and their effectiveness. We aim to support research of visualization designs to capture and communicate the process of data analysis, which is also referred to as analytic provenance. We provide detailed samples of analysis logs from user studies that can be used as a basis for the design and evaluation of provenance visualizations.
Project Lead: Eric Ragan, PhD; Indie Lab at University of Florida
Visualization Designs
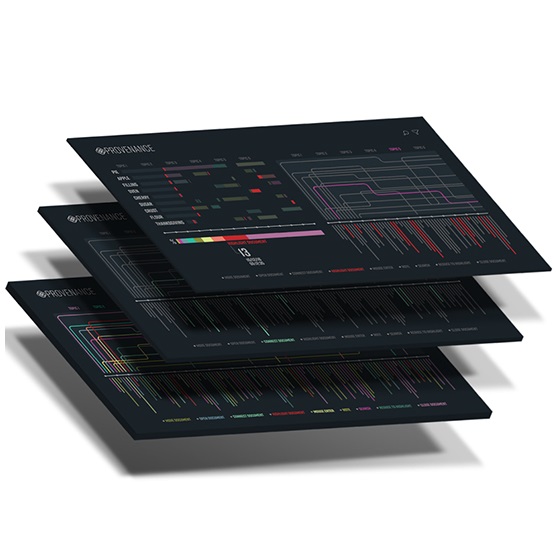
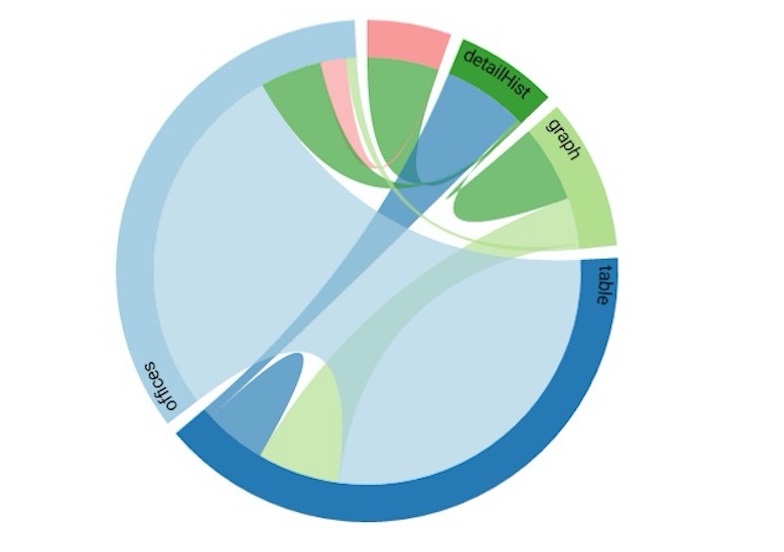
Our research explores a breadth of designs for supporting meta-analysis of human data analysis behaviors and interactions. Different designs can priortize different types of information such as action sequences, data content accessed, or key data findings and insights. Designs must balance level of detail for easy comphrension while providing enough low-level information for thorough inspection.

Research Papers and Publications
Research papers are available for more details about our work on analytic transparancy, provenance, and explanatory systems. Research contributions include visualization techniques, controlled experiments, qualitative studies, and methods to support human understanding of data, algorithms, and human sensemaking.
Analytic Provenance Datasets
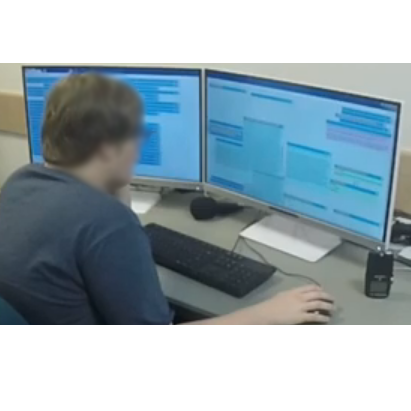
Research of provenance visualization requires analysis records as samples to visualize. We conducted sets of user studies using text analysis scenarios and multidimensional data analysis to generate provenance test data. The data sets consist of interaction logs over time, the data and interface elements interacted with, think-aloud comments from participant "analysts", and researcher-annotated labels.