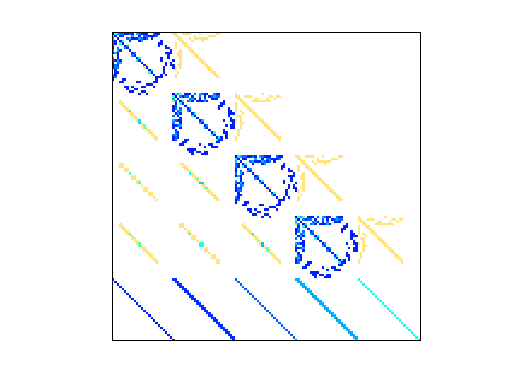
Matrix: YZhou/circuit204
Description: Circuit simulation problem, Y. Zhou, Carleton Univ, Canada
|
|
| (bipartite graph drawing) | (graph drawing of A+A') |
 |
 |
 |
| Matrix properties | |
| number of rows | 1,020 |
| number of columns | 1,020 |
| nonzeros | 5,883 |
| structural full rank? | yes |
| structural rank | 1,020 |
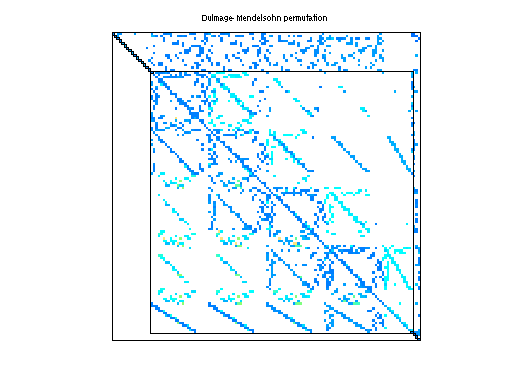
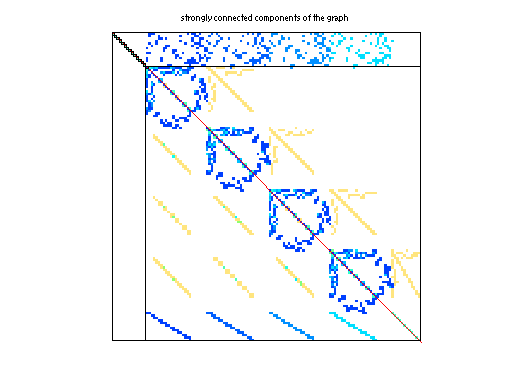
| # of blocks from dmperm | 157 |
| # strongly connected comp. | 114 |
| explicit zero entries | 0 |
| nonzero pattern symmetry | 44% |
| numeric value symmetry | 37% |
| type | real |
| structure | unsymmetric |
| Cholesky candidate? | no |
| positive definite? | no |
| author | Y. Zhou |
| editor | T. Davis |
| date | 2008 |
| kind | circuit simulation problem |
| 2D/3D problem? | no |
Notes:
block size 204*204
| Ordering statistics: | result |
| nnz(chol(P*(A+A'+s*I)*P')) with AMD | 10,796 |
| Cholesky flop count | 1.4e+05 |
| nnz(L+U), no partial pivoting, with AMD | 20,572 |
| nnz(V) for QR, upper bound nnz(L) for LU, with COLAMD | 17,570 |
| nnz(R) for QR, upper bound nnz(U) for LU, with COLAMD | 37,329 |
| SVD-based statistics: | |
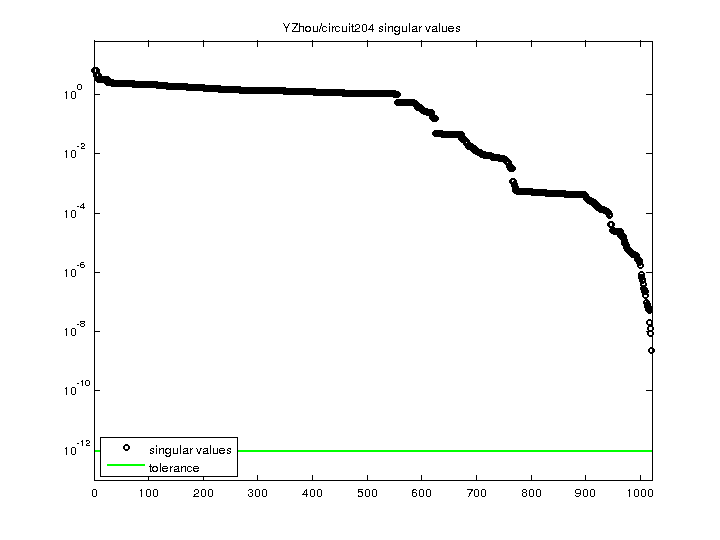
| norm(A) | 6.511 |
| min(svd(A)) | 2.33595e-09 |
| cond(A) | 2.78731e+09 |
| rank(A) | 1,020 |
| sprank(A)-rank(A) | 0 |
| null space dimension | 0 |
| full numerical rank? | yes |
| singular values (MAT file): | click here |
| SVD method used: | s = svd (full (A)) ; |
| status: | ok |
For a description of the statistics displayed above, click here.
Maintained by Tim Davis, last updated 12-Mar-2014.
Matrix pictures by cspy, a MATLAB function in the CSparse package.
Matrix graphs by Yifan Hu, AT&T Labs Visualization Group.