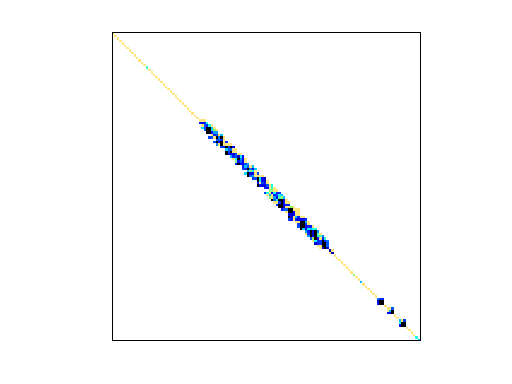
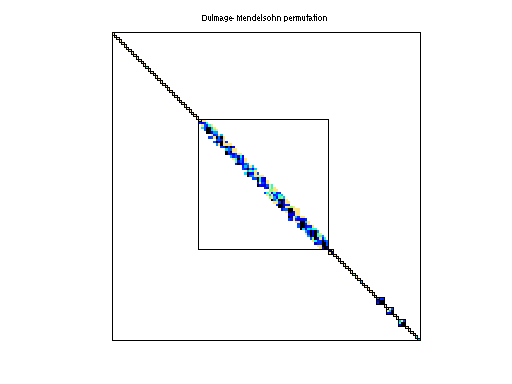
Matrix: VanVelzen/std1_Jac2_db
Description: Chemical process simulation, Nils van Velzen (diagonal blocks only)
|
|
| (bipartite graph drawing) | (graph drawing of A+A') |
 |
 |
| Matrix properties | |
| number of rows | 21,982 |
| number of columns | 21,982 |
| nonzeros | 498,771 |
| structural full rank? | yes |
| structural rank | 21,982 |
| # of blocks from dmperm | 11,091 |
| # strongly connected comp. | 11,091 |
| explicit zero entries | 0 |
| nonzero pattern symmetry | 33% |
| numeric value symmetry | 0% |
| type | real |
| structure | unsymmetric |
| Cholesky candidate? | no |
| positive definite? | no |
| author | N. van Velzen |
| editor | T. Davis |
| date | 2006 |
| kind | chemical process simulation problem |
| 2D/3D problem? | no |
| Additional fields | size and type |
| b | full 21982-by-1 |
| Ordering statistics: | result |
| nnz(chol(P*(A+A'+s*I)*P')) with AMD | 2,315,950 |
| Cholesky flop count | 1.3e+09 |
| nnz(L+U), no partial pivoting, with AMD | 4,609,918 |
| nnz(V) for QR, upper bound nnz(L) for LU, with COLAMD | 1,484,010 |
| nnz(R) for QR, upper bound nnz(U) for LU, with COLAMD | 2,995,888 |
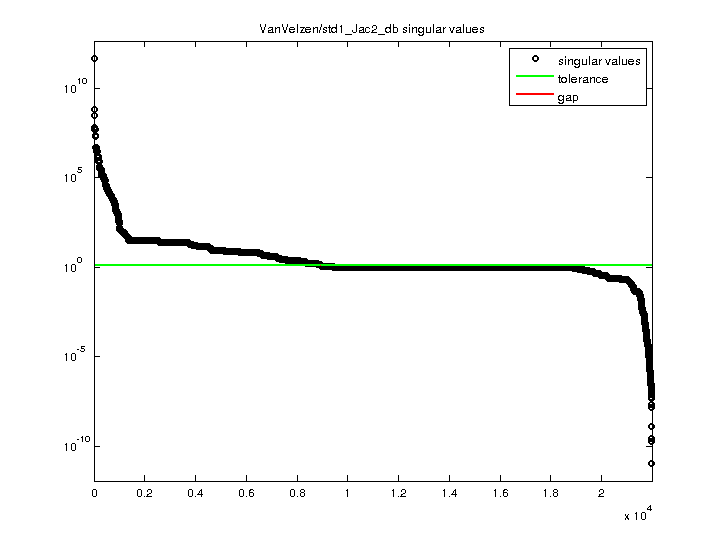
| SVD-based statistics: | |
| norm(A) | 4.45922e+11 |
| min(svd(A)) | 1.14851e-11 |
| cond(A) | 3.8826e+22 |
| rank(A) | 8,940 |
| sprank(A)-rank(A) | 13,042 |
| null space dimension | 13,042 |
| full numerical rank? | no |
| singular value gap | 1.00515 |
| singular values (MAT file): | click here |
| SVD method used: | s = svd (full (R)) ; where [~,R,E] = spqr (A) with droptol of zero |
| status: | ok |
For a description of the statistics displayed above, click here.
Maintained by Tim Davis, last updated 12-Mar-2014.
Matrix pictures by cspy, a MATLAB function in the CSparse package.
Matrix graphs by Yifan Hu, AT&T Labs Visualization Group.