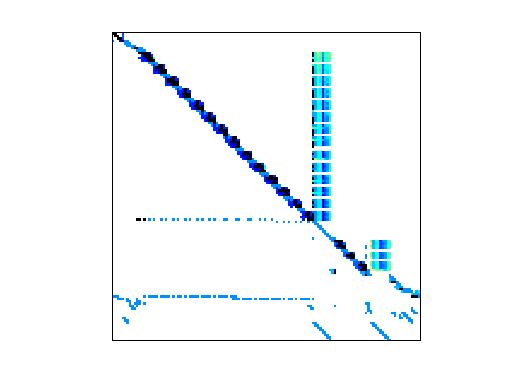
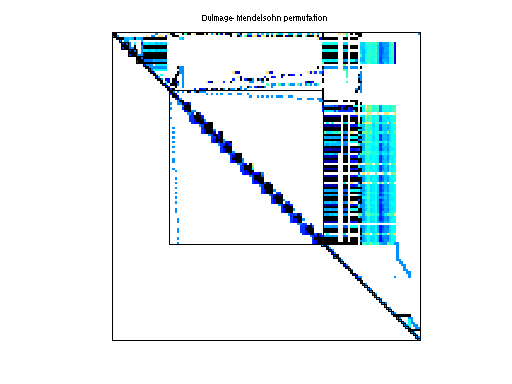
Matrix: VanVelzen/Zd_Jac6
Description: Chemical process simulation, Nils van Velzen (complete problem)
|
|
| (bipartite graph drawing) | (graph drawing of A+A') |
 |
 |
| Matrix properties | |
| number of rows | 22,835 |
| number of columns | 22,835 |
| nonzeros | 1,711,557 |
| structural full rank? | yes |
| structural rank | 22,835 |
| # of blocks from dmperm | 9,990 |
| # strongly connected comp. | 1 |
| explicit zero entries | 426 |
| nonzero pattern symmetry | 0% |
| numeric value symmetry | 0% |
| type | real |
| structure | unsymmetric |
| Cholesky candidate? | no |
| positive definite? | no |
| author | N. van Velzen |
| editor | T. Davis |
| date | 2006 |
| kind | chemical process simulation problem |
| 2D/3D problem? | no |
| Additional fields | size and type |
| b | full 22835-by-1 |
| Ordering statistics: | result |
| nnz(chol(P*(A+A'+s*I)*P')) with AMD | 53,997,211 |
| Cholesky flop count | 3.5e+11 |
| nnz(L+U), no partial pivoting, with AMD | 107,971,587 |
| nnz(V) for QR, upper bound nnz(L) for LU, with COLAMD | 4,171,457 |
| nnz(R) for QR, upper bound nnz(U) for LU, with COLAMD | 20,088,643 |
Note that all matrix statistics (except nonzero pattern symmetry) exclude the 426 explicit zero entries.
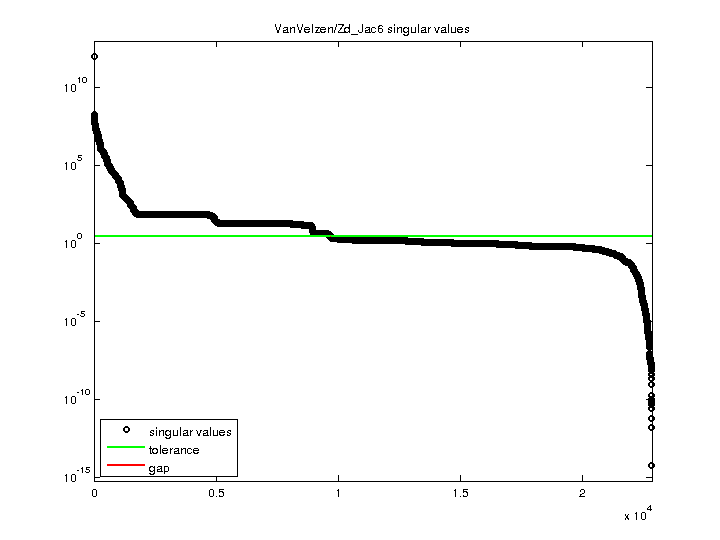
| SVD-based statistics: | |
| norm(A) | 9.45145e+11 |
| min(svd(A)) | 6.19742e-15 |
| cond(A) | 1.52506e+26 |
| rank(A) | 9,683 |
| sprank(A)-rank(A) | 13,152 |
| null space dimension | 13,152 |
| full numerical rank? | no |
| singular value gap | 1.02677 |
| singular values (MAT file): | click here |
| SVD method used: | s = piro_band_svd (A) |
| status: | ok |
For a description of the statistics displayed above, click here.
Maintained by Tim Davis, last updated 12-Mar-2014.
Matrix pictures by cspy, a MATLAB function in the CSparse package.
Matrix graphs by Yifan Hu, AT&T Labs Visualization Group.