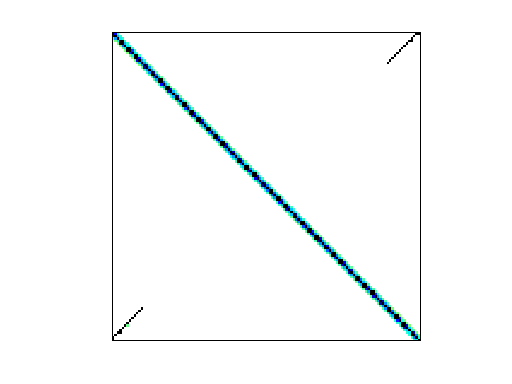
Matrix: Simon/bbmat
Description: BEAM + BAILEY 2D AIRFOIL EXACT JACOBIAN: MACH = 0.08, ANGLE = 2.0, TURB
|
|
| (bipartite graph drawing) | (graph drawing of A+A') |
 |
| Matrix properties | |
| number of rows | 38,744 |
| number of columns | 38,744 |
| nonzeros | 1,771,722 |
| structural full rank? | yes |
| structural rank | 38,744 |
| # of blocks from dmperm | 1 |
| # strongly connected comp. | 1 |
| explicit zero entries | 0 |
| nonzero pattern symmetry | 53% |
| numeric value symmetry | 0% |
| type | real |
| structure | unsymmetric |
| Cholesky candidate? | no |
| positive definite? | no |
| author | H. Simon |
| editor | H. Simon |
| date | 1993 |
| kind | computational fluid dynamics problem |
| 2D/3D problem? | yes |
| Additional fields | size and type |
| b | full 38744-by-1 |
| x | full 38744-by-1 |
| Ordering statistics: | result |
| nnz(chol(P*(A+A'+s*I)*P')) with AMD | 23,112,409 |
| Cholesky flop count | 2.2e+10 |
| nnz(L+U), no partial pivoting, with AMD | 46,186,074 |
| nnz(V) for QR, upper bound nnz(L) for LU, with COLAMD | 23,041,854 |
| nnz(R) for QR, upper bound nnz(U) for LU, with COLAMD | 44,250,239 |
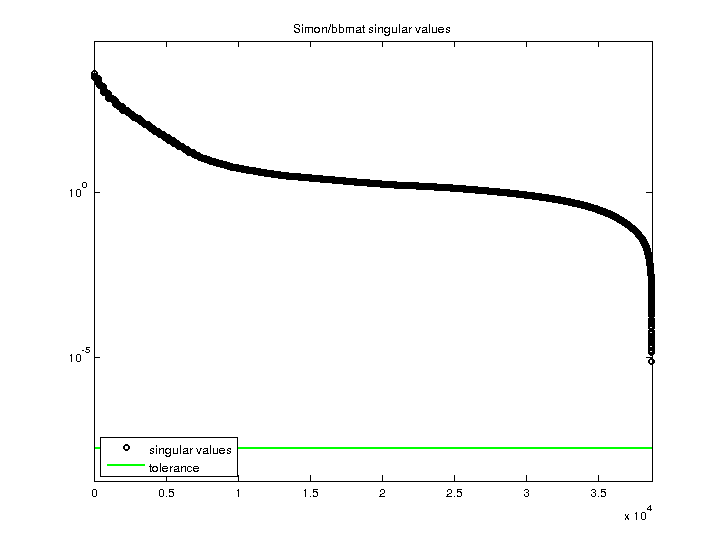
| SVD-based statistics: | |
| norm(A) | 3992.38 |
| min(svd(A)) | 7.35089e-06 |
| cond(A) | 5.43116e+08 |
| rank(A) | 38,744 |
| sprank(A)-rank(A) | 0 |
| null space dimension | 0 |
| full numerical rank? | yes |
| singular values (MAT file): | click here |
| SVD method used: | s = svd (full (A)) |
| status: | ok |
For a description of the statistics displayed above, click here.
Maintained by Tim Davis, last updated 12-Mar-2014.
Matrix pictures by cspy, a MATLAB function in the CSparse package.
Matrix graphs by Yifan Hu, AT&T Labs Visualization Group.