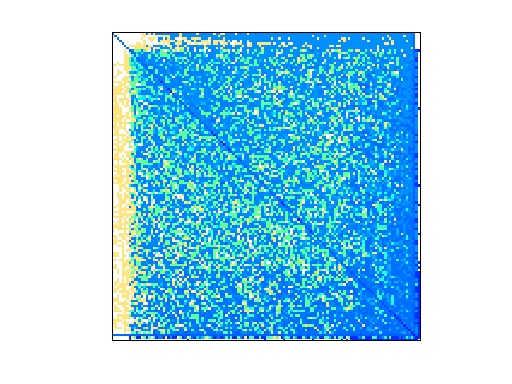
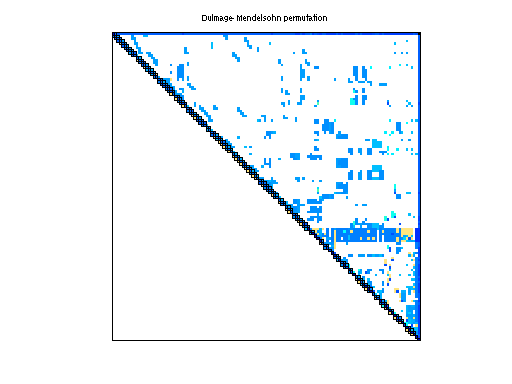
Matrix: Sandia/mult_dcop_03
Description: Sandia/mult_dcop_03 circuit simulation matrix. Sandia National Lab.
|
|
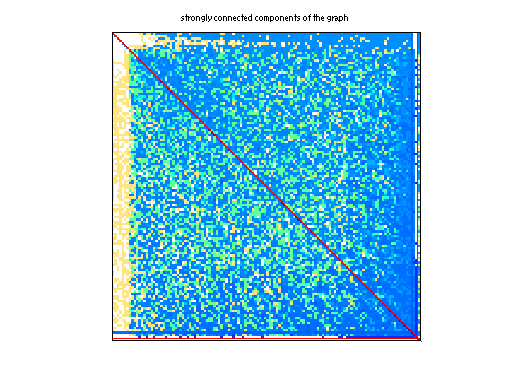
| (bipartite graph drawing) | (graph drawing of A+A') |
 |
 |
 |
| Matrix properties | |
| number of rows | 25,187 |
| number of columns | 25,187 |
| nonzeros | 193,216 |
| structural full rank? | yes |
| structural rank | 25,187 |
| # of blocks from dmperm | 7,447 |
| # strongly connected comp. | 107 |
| explicit zero entries | 0 |
| nonzero pattern symmetry | 61% |
| numeric value symmetry | 1% |
| type | real |
| structure | unsymmetric |
| Cholesky candidate? | no |
| positive definite? | no |
| author | R. Hoekstra |
| editor | T. Davis |
| date | 2003 |
| kind | subsequent circuit simulation problem |
| 2D/3D problem? | no |
| Additional fields | size and type |
| b | full 25187-by-1 |
Notes:
next: - first: Sandia/mult_dcop_01
| Ordering statistics: | result |
| nnz(chol(P*(A+A'+s*I)*P')) with AMD | 605,623 |
| Cholesky flop count | 1.1e+08 |
| nnz(L+U), no partial pivoting, with AMD | 1,186,059 |
| nnz(V) for QR, upper bound nnz(L) for LU, with COLAMD | 48,704,190 |
| nnz(R) for QR, upper bound nnz(U) for LU, with COLAMD | 283,235,909 |
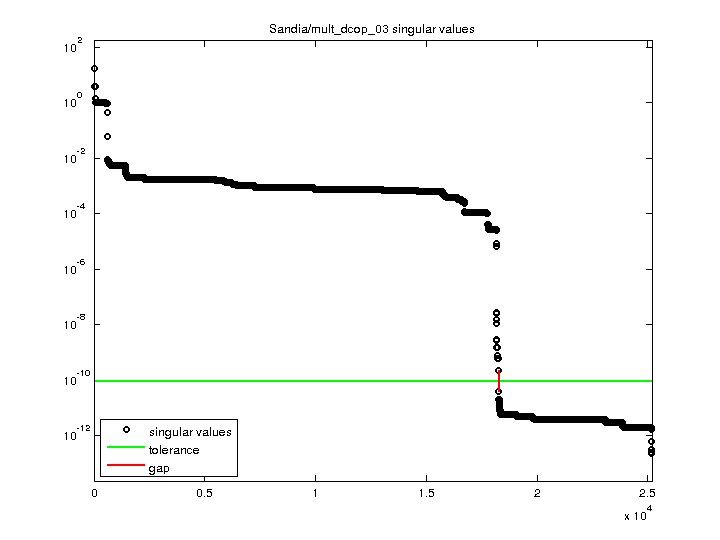
| SVD-based statistics: | |
| norm(A) | 17.1762 |
| min(svd(A)) | 2.36177e-13 |
| cond(A) | 7.27261e+13 |
| rank(A) | 18,271 |
| sprank(A)-rank(A) | 6,916 |
| null space dimension | 6,916 |
| full numerical rank? | no |
| singular value gap | 5.51581 |
| singular values (MAT file): | click here |
| SVD method used: | s = svd (full (A)) |
| status: | ok |
For a description of the statistics displayed above, click here.
Maintained by Tim Davis, last updated 12-Mar-2014.
Matrix pictures by cspy, a MATLAB function in the CSparse package.
Matrix graphs by Yifan Hu, AT&T Labs Visualization Group.