Matrix: SNAP/cit-Patents
Description: Citation network among US Patents
|
|
| (bipartite graph drawing) | (graph drawing of A+A') |
 |
 |
| Matrix properties | |
| number of rows | 3,774,768 |
| number of columns | 3,774,768 |
| nonzeros | 16,518,948 |
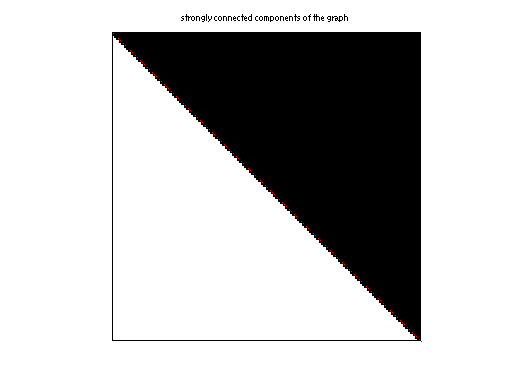
| # strongly connected comp. | 3,774,768 |
| explicit zero entries | 0 |
| nonzero pattern symmetry | 0% |
| numeric value symmetry | 0% |
| type | binary |
| structure | unsymmetric |
| Cholesky candidate? | no |
| positive definite? | no |
| author | B. Hall, A. Jaffe, M. Trajtenberg |
| editor | J. Leskovec |
| date | 1999 |
| kind | directed graph |
| 2D/3D problem? | no |
| Additional fields | size and type |
| nodename | full 3774768-by-1 |
Notes:
Networks from SNAP (Stanford Network Analysis Platform) Network Data Sets,
Jure Leskovec http://snap.stanford.edu/data/index.html
email jure at cs.stanford.edu

Patent citation network

Dataset information

U.S. patent dataset is maintained by the National Bureau of Economic Research.
The data set spans 37 years (January 1, 1963 to December 30, 1999), and
includes all the utility patents granted during that period, totaling 3,923,922
patents. The citation graph includes all citations made by patents granted
between 1975 and 1999, totaling 16,522,438 citations. For the patents dataset
there are 1,803,511 nodes for which we have no information about their
citations (we only have the in-links).

The data was originally released by NBER.

Dataset statistics
Nodes   3774768
Edges   16518948
Nodes in largest WCC    3764117 (0.997)
Edges in largest WCC    16511741 (1.000)
Nodes in largest SCC    1 (0.000)
Edges in largest SCC    0 (0.000)
Average clustering coefficient  0.0919
Number of triangles     7515023
Fraction of closed triangles    0.06714
Diameter (longest shortest path)    22
90-percentile effective diameter    9.4

Source (citation)

J. Leskovec, J. Kleinberg and C. Faloutsos. Graphs over Time: Densification
Laws, Shrinking Diameters and Possible Explanations. ACM SIGKDD International
Conference on Knowledge Discovery and Data Mining (KDD), 2005.

Hall, B. H., A. B. Jaffe, and M. Trajtenberg (2001). "The NBER Patent Citation
Data File: Lessons, Insights and Methodological Tools." NBER Working Paper
8498.  http://papers.nber.org/papers/w8498.pdf

Files
File    Description
cit-Patents.txt.gz  US Patent citation network 1975-1999
NBER Patents    Complete US Patent data (includes time, classification, and
                patent invernetor data), at http://www.nber.org/patents/


NOTE: a similar version this problem already appears in the UF Collection:

cit-Patents         in SNAP         n: 3,774,768   nz: 16,518,948
                    Pajek/patents   n: same        nz: 14,970,767

                    Both of these come from the NBER data.  However,
                    the edges are not the same.  The SNAP/cit-Patents
                    data is a strict superset of the Pajek/patents graph.
                    If A0 = Pajek/patents and A1 = SNAP/cit-Patents,
                    then nnz(A1-A0) = nnz(A1)-nnz(A0) = 1,548,181.
                    All edges in A0 appear in A1.

                    The aux data is not the same.  Pajek/patents contains
                    more auxiliary data for each node.  This data can be
                    used to interpret the SNAP/cit-Patents graph as well,
                    since the nodes match up from one graph to the other.
For a description of the statistics displayed above, click here.
Maintained by Tim Davis, last updated 12-Mar-2014.
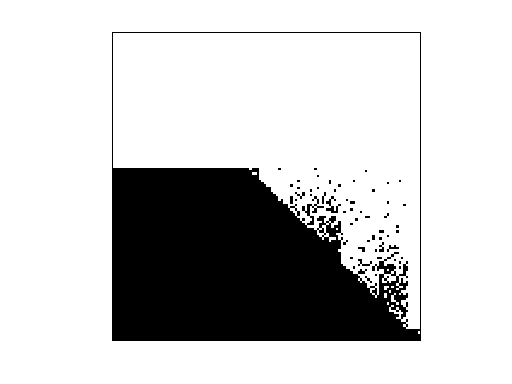
Matrix pictures by cspy, a MATLAB function in the CSparse package.
Matrix graphs by Yifan Hu, AT&T Labs Visualization Group.