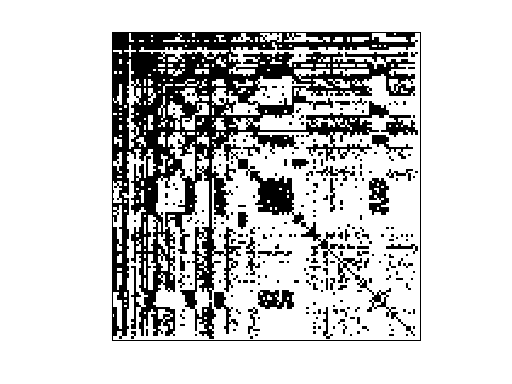
Matrix: SNAP/as-735
Description: (735 graphs) daily instances(graphs) from 11/8/97-1/2/00
|
| (undirected graph drawing) |
 |
| Matrix properties | |
| number of rows | 7,716 |
| number of columns | 7,716 |
| nonzeros | 26,467 |
| # strongly connected comp. | 1,243 |
| explicit zero entries | 0 |
| nonzero pattern symmetry | symmetric |
| numeric value symmetry | symmetric |
| type | binary |
| structure | symmetric |
| Cholesky candidate? | no |
| positive definite? | no |
| author | D. Meyer |
| editor | J. Leskovec |
| date | 2000 |
| kind | undirected graph sequence |
| 2D/3D problem? | no |
| Additional fields | size and type |
| G | cell 733-by-1 |
| Gname | full 733-by-10 |
| nodename | full 7716-by-1 |
Notes:
Networks from SNAP (Stanford Network Analysis Platform) Network Data Sets,
Jure Leskovec http://snap.stanford.edu/data/index.html
email jure at cs.stanford.edu

Autonomous systems AS-735

Dataset information

The graph of routers comprising the Internet can be organized into sub-graphs
called Autonomous Systems (AS). Each AS exchanges traffic flows with some
neighbors (peers). We can construct a communication network of who-talks-to-
whom from the BGP (Border Gateway Protocol) logs.

The data was collected from University of Oregon Route Views Project
(http://www.routeviews.org/) - Online data and reports. The dataset contains
735 daily instances which span an interval of 785 days from November 8 1997 to
January 2 2000. In contrast to citation networks, where nodes and edges only
get added (not deleted) over time, the AS dataset also exhibits both the
addition and deletion of the nodes and edges over time.

Dataset statistics are calculated for the graph with the highest number of
nodes and edges (dataset from January 02 2000):

Dataset statistics
Nodes   6474
Edges   13233
Nodes in largest WCC    6474 (1.000)
Edges in largest WCC    13233 (1.000)
Nodes in largest SCC    6474 (1.000)
Edges in largest SCC    13233 (1.000)
Average clustering coefficient  0.3913
Number of triangles     6584
Fraction of closed triangles    0.009591
Diameter (longest shortest path)    9
90-percentile effective diameter    4.6

Source (citation)

J. Leskovec, J. Kleinberg and C. Faloutsos. Graphs over Time: Densification
Laws, Shrinking Diameters and Possible Explanations. ACM SIGKDD International
Conference on Knowledge Discovery and Data Mining (KDD), 2005.


Files
File    Description
as20000102.txt.gz   Autonomous Systems graph from January 02 2000
as.tar.gz   735 Autonomous Systems graphs from November 8 1997 to
             January 02 2000

NOTE:  In the UF collection, the primary matrix (Problem.A) is the
as20000102 matrix from January 02 2000 (the last graph in the sequence).

The nodes are uniform across all graphs in the sequence in the UF collection.
That is, nodes do not come and go.  A node that is "gone" simply has no edges.
This is to allow comparisons across each node in the graphs.
Problem.aux.nodenames gives the node numbers of the original problem.  So
row/column i in the matrix is always node number Problem.aux.nodenames(i) in
all the graphs.

Problem.aux.G{k} is the kth graph in the sequence.
Problem.aux.Gname(k,:) is the name of the kth graph.
| SVD-based statistics: | |
| norm(A) | 46.8926 |
| min(svd(A)) | 0 |
| cond(A) | Inf |
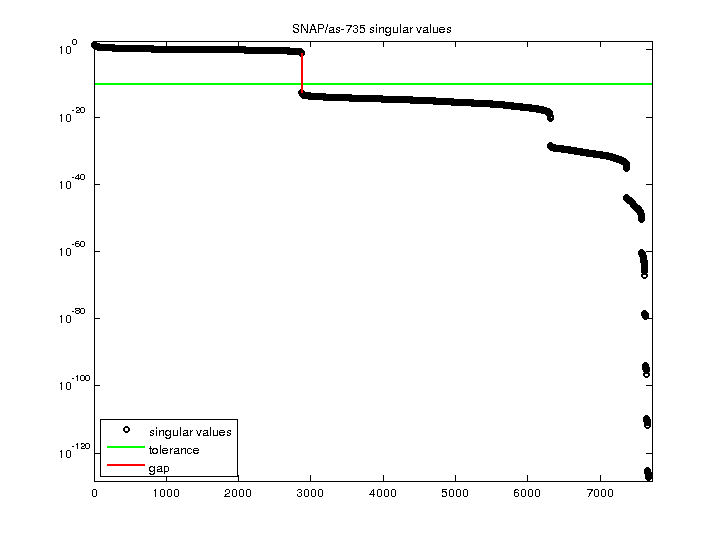
| rank(A) | 2,875 |
| null space dimension | 4,841 |
| full numerical rank? | no |
| singular value gap | 5.08366e+11 |
| singular values (MAT file): | click here |
| SVD method used: | s = svd (full (A)) ; |
| status: | ok |
For a description of the statistics displayed above, click here.
Maintained by Tim Davis, last updated 12-Mar-2014.
Matrix pictures by cspy, a MATLAB function in the CSparse package.
Matrix graphs by Yifan Hu, AT&T Labs Visualization Group.