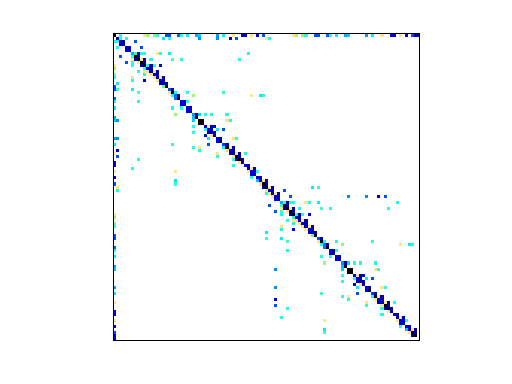
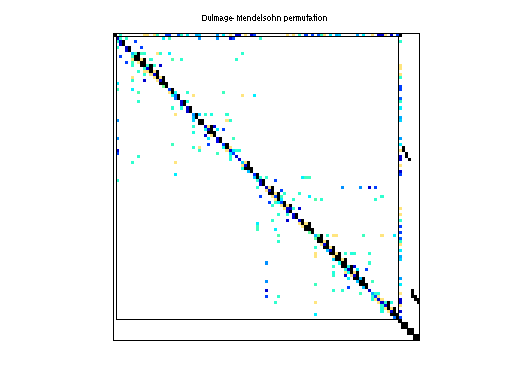
Matrix: Rajat/rajat05
Description: Rajat/rajat05 circuit simulation matrix
|
|
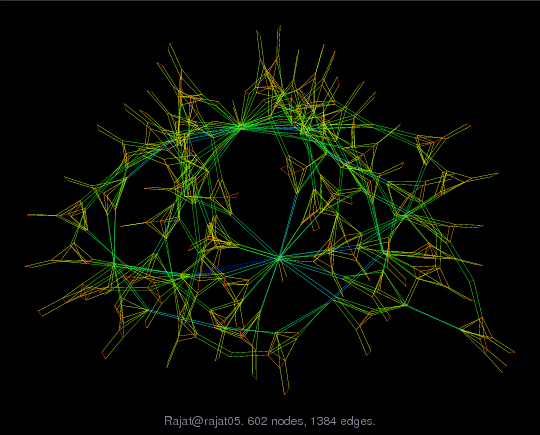
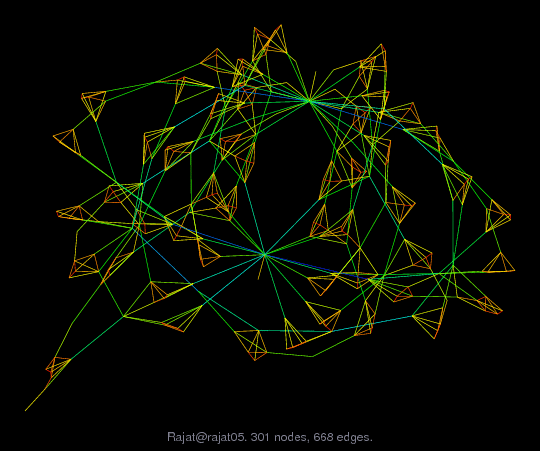
| (bipartite graph drawing) | (graph drawing of A+A') |
 |
 |
 |
| Matrix properties | |
| number of rows | 301 |
| number of columns | 301 |
| nonzeros | 1,250 |
| structural full rank? | yes |
| structural rank | 301 |
| # of blocks from dmperm | 15 |
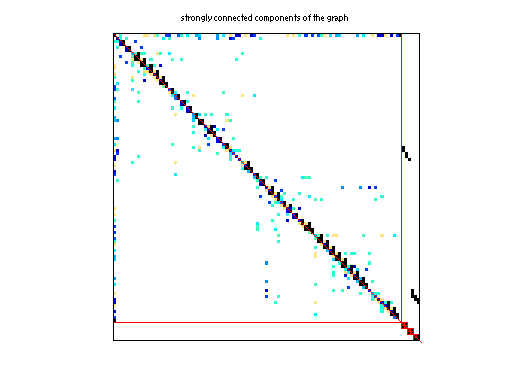
| # strongly connected comp. | 9 |
| explicit zero entries | 134 |
| nonzero pattern symmetry | 77% |
| numeric value symmetry | 71% |
| type | real |
| structure | unsymmetric |
| Cholesky candidate? | no |
| positive definite? | no |
| author | Rajat |
| editor | T. Davis |
| date | 2004 |
| kind | circuit simulation problem |
| 2D/3D problem? | no |
| Ordering statistics: | result |
| nnz(chol(P*(A+A'+s*I)*P')) with AMD | 1,169 |
| Cholesky flop count | 4.7e+03 |
| nnz(L+U), no partial pivoting, with AMD | 2,037 |
| nnz(V) for QR, upper bound nnz(L) for LU, with COLAMD | 1,938 |
| nnz(R) for QR, upper bound nnz(U) for LU, with COLAMD | 3,587 |
Note that all matrix statistics (except nonzero pattern symmetry) exclude the 134 explicit zero entries.
| SVD-based statistics: | |
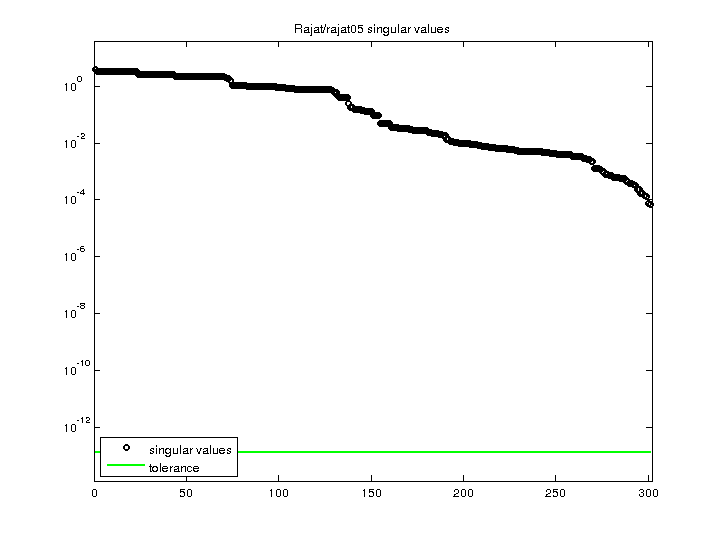
| norm(A) | 3.83917 |
| min(svd(A)) | 7.11913e-05 |
| cond(A) | 53927.5 |
| rank(A) | 301 |
| sprank(A)-rank(A) | 0 |
| null space dimension | 0 |
| full numerical rank? | yes |
| singular values (MAT file): | click here |
| SVD method used: | s = svd (full (A)) ; |
| status: | ok |
For a description of the statistics displayed above, click here.
Maintained by Tim Davis, last updated 12-Mar-2014.
Matrix pictures by cspy, a MATLAB function in the CSparse package.
Matrix graphs by Yifan Hu, AT&T Labs Visualization Group.