Matrix: Pajek/GD98_a
Description: Pajek network: Graph Drawing contest 1998
|
|
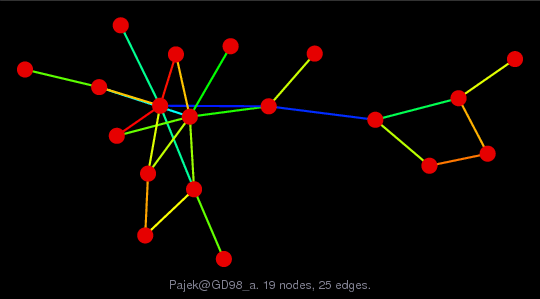
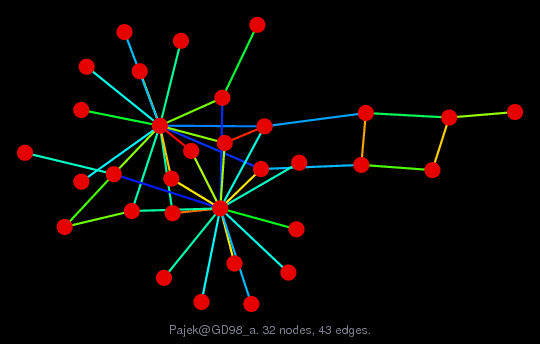
| (bipartite graph drawing) | (graph drawing of A+A') |
 |
|
 |
 |
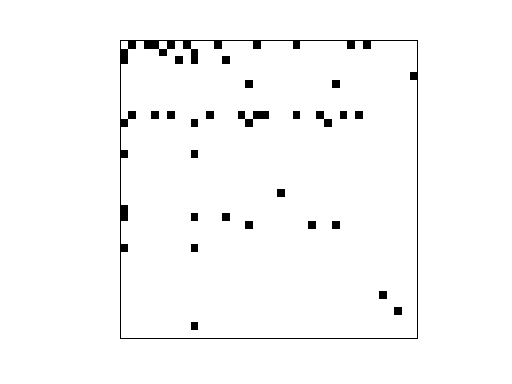
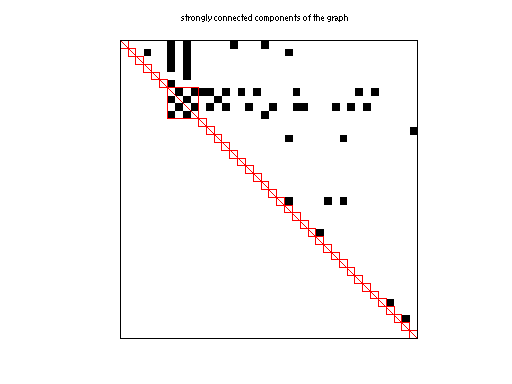
| Matrix properties | |
| number of rows | 38 |
| number of columns | 38 |
| nonzeros | 50 |
| # strongly connected comp. | 35 |
| explicit zero entries | 0 |
| nonzero pattern symmetry | 16% |
| numeric value symmetry | 16% |
| type | binary |
| structure | unsymmetric |
| Cholesky candidate? | no |
| positive definite? | no |
| author | Graph Drawing Contest |
| editor | V. Batagelj |
| date | 1998 |
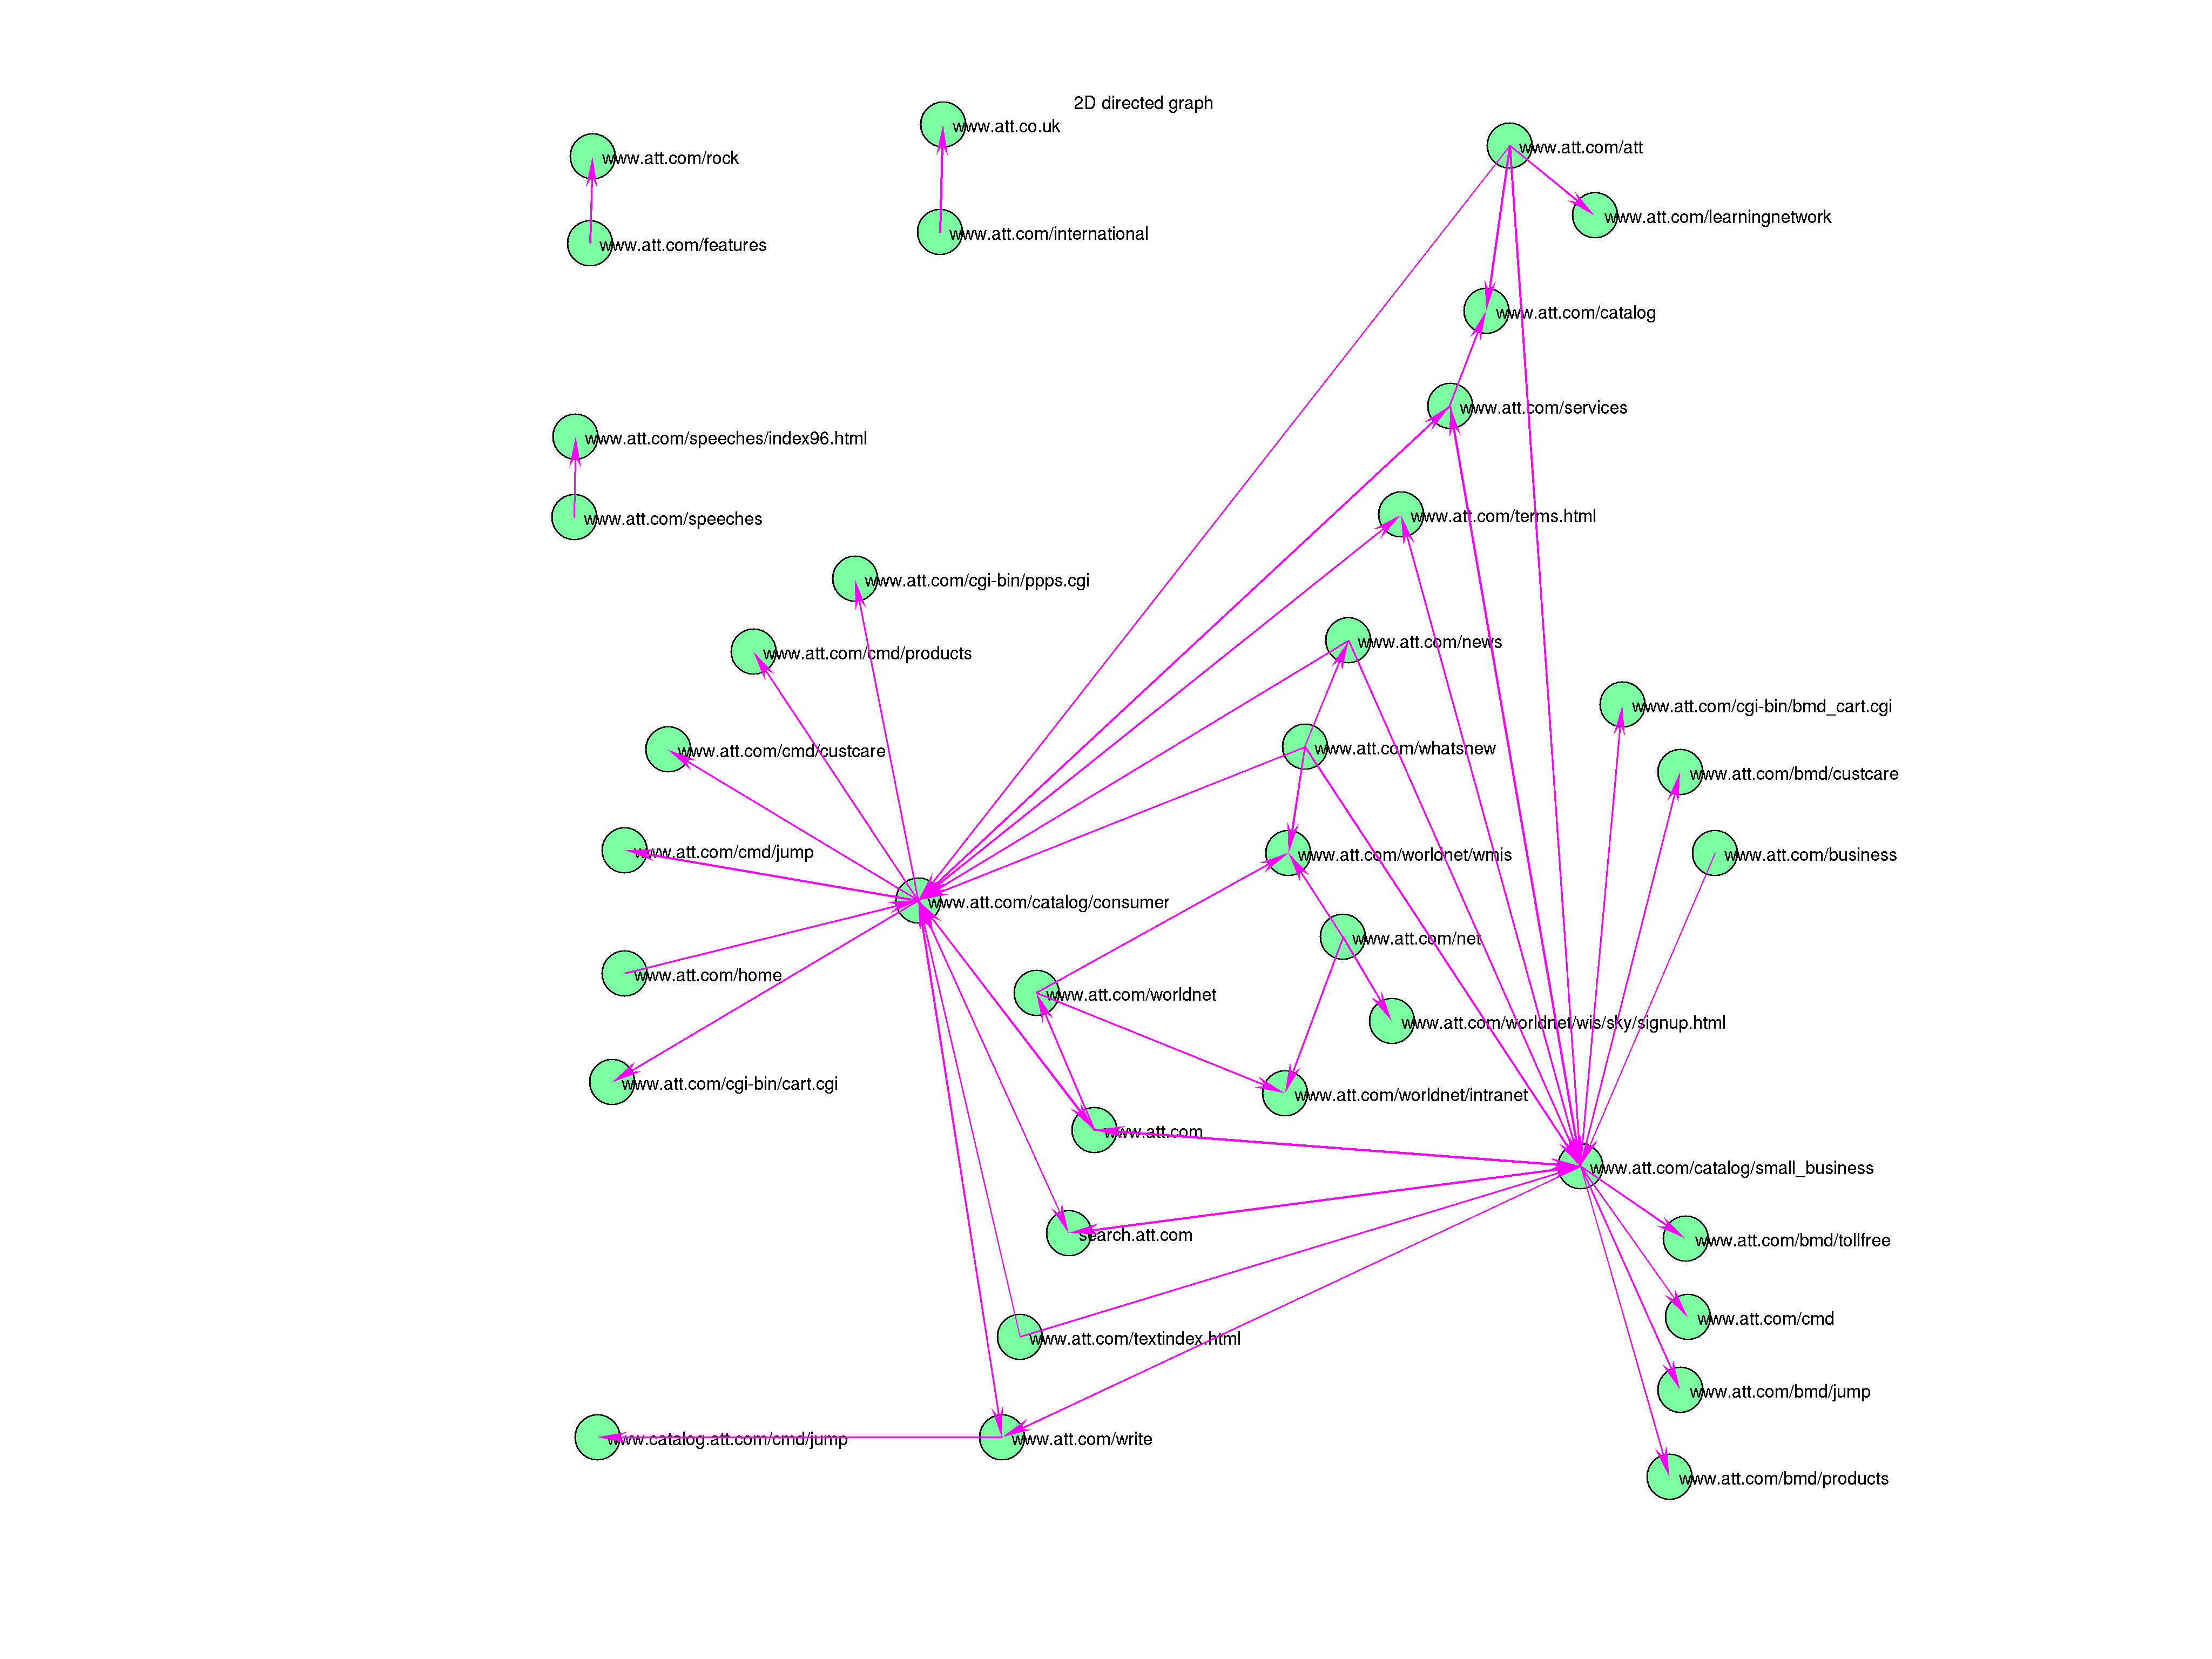
| kind | directed graph |
| 2D/3D problem? | no |
| Additional fields | size and type |
| nodename | full 38-by-40 |
| coord | full 38-by-2 |
Notes:
------------------------------------------------------------------------------
Pajek network converted to sparse adjacency matrix for inclusion in UF sparse
matrix collection, Tim Davis.  For Pajek datasets, See V. Batagelj & A. Mrvar,
http://vlado.fmf.uni-lj.si/pub/networks/data/.
------------------------------------------------------------------------------
The original problem had 3D xyz coordinates, but all values of z were equal
to 0.5, and have been removed.  This graph has 2D coordinates.
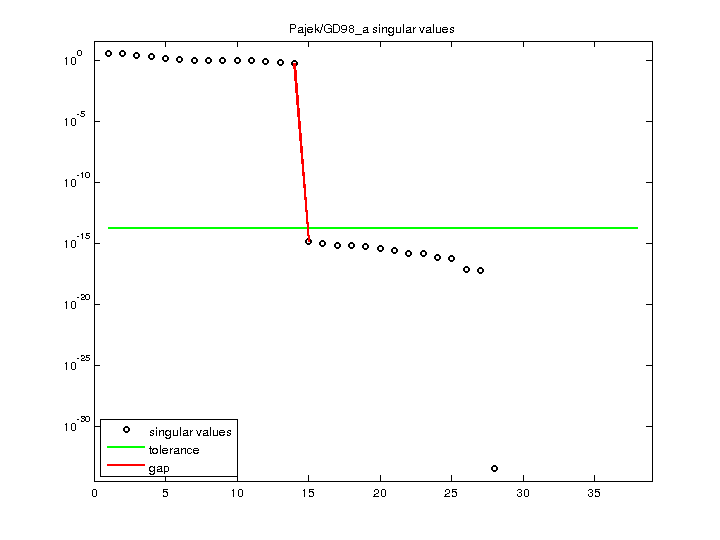
| SVD-based statistics: | |
| norm(A) | 3.94017 |
| min(svd(A)) | 0 |
| cond(A) | Inf |
| rank(A) | 14 |
| null space dimension | 24 |
| full numerical rank? | no |
| singular value gap | 3.77784e+14 |
| singular values (MAT file): | click here |
| SVD method used: | s = svd (full (A)) |
| status: | ok |
For a description of the statistics displayed above, click here.
Maintained by Tim Davis, last updated 12-Mar-2014.
Matrix pictures by cspy, a MATLAB function in the CSparse package.
Matrix graphs by Yifan Hu, AT&T Labs Visualization Group.