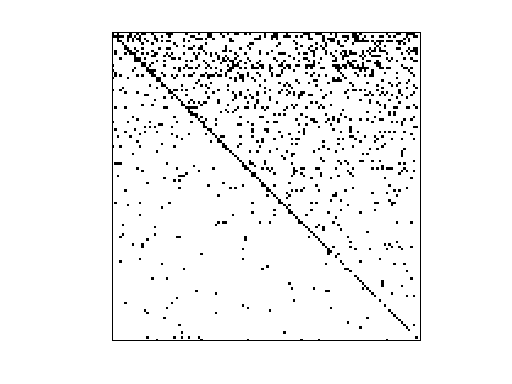
Matrix: Pajek/CSphd
Description: Pajek network: PhD's in computer science
|
|
| (bipartite graph drawing) | (graph drawing of A+A') |
 |
 |
| Matrix properties | |
| number of rows | 1,882 |
| number of columns | 1,882 |
| nonzeros | 1,740 |
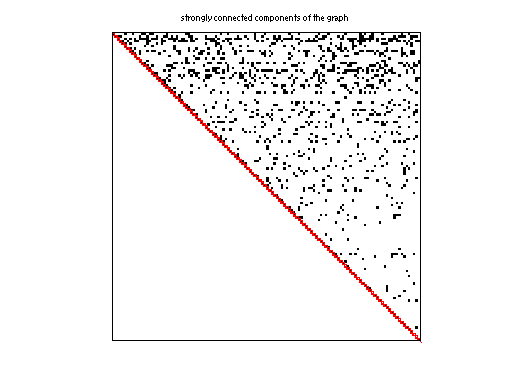
| # strongly connected comp. | 1,882 |
| explicit zero entries | 0 |
| nonzero pattern symmetry | 0% |
| numeric value symmetry | 0% |
| type | binary |
| structure | unsymmetric |
| Cholesky candidate? | no |
| positive definite? | no |
| author | |
| editor | V. Batagelj |
| date | 2006 |
| kind | directed graph |
| 2D/3D problem? | no |
| Additional fields | size and type |
| phdyear | full 1882-by-1 |
| nodename | full 1882-by-32 |
Notes:
------------------------------------------------------------------------------
Pajek network converted to sparse adjacency matrix for inclusion in UF sparse
matrix collection, Tim Davis.  For Pajek datasets, See V. Batagelj & A. Mrvar,
http://vlado.fmf.uni-lj.si/pub/networks/data/.
------------------------------------------------------------------------------
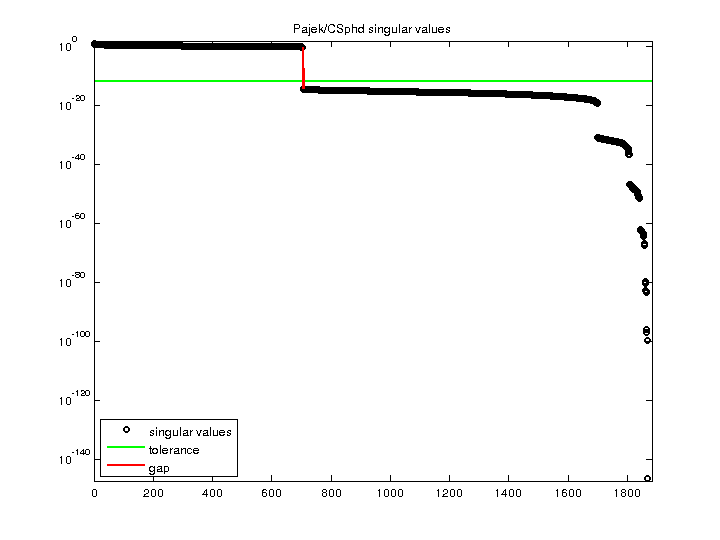
| SVD-based statistics: | |
| norm(A) | 6.7099 |
| min(svd(A)) | 0 |
| cond(A) | Inf |
| rank(A) | 705 |
| null space dimension | 1,177 |
| full numerical rank? | no |
| singular value gap | 1.02236e+14 |
| singular values (MAT file): | click here |
| SVD method used: | s = svd (full (A)) ; |
| status: | ok |
For a description of the statistics displayed above, click here.
Maintained by Tim Davis, last updated 12-Mar-2014.
Matrix pictures by cspy, a MATLAB function in the CSparse package.
Matrix graphs by Yifan Hu, AT&T Labs Visualization Group.