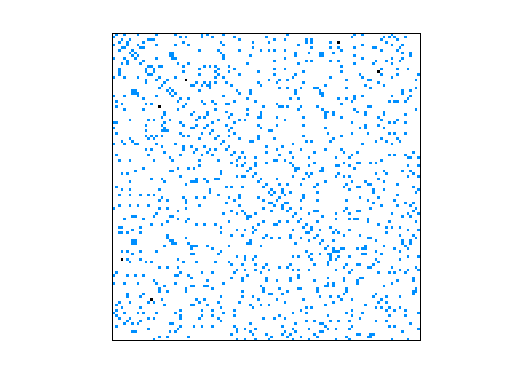
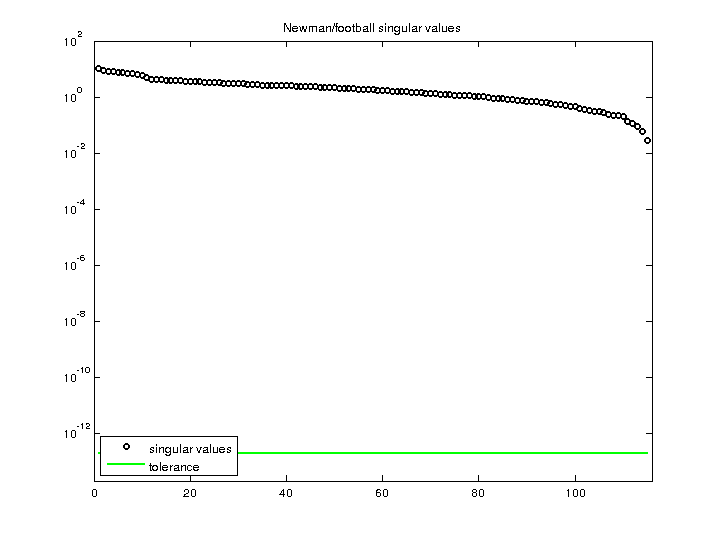
Matrix: Newman/football
Description: American football games between Div IA colleges, Fall 2000
|
| (undirected graph drawing) |
 |
| Matrix properties | |
| number of rows | 115 |
| number of columns | 115 |
| nonzeros | 1,226 |
| # strongly connected comp. | 1 |
| explicit zero entries | 0 |
| nonzero pattern symmetry | symmetric |
| numeric value symmetry | symmetric |
| type | integer |
| structure | symmetric |
| Cholesky candidate? | no |
| positive definite? | no |
| author | M. Girvan, M. Newman |
| editor | M. Newman |
| date | 2002 |
| kind | undirected multigraph |
| 2D/3D problem? | no |
| Additional fields | size and type |
| nodename | full 115-by-20 |
| nodevalue | full 115-by-1 |
Notes:
Network collection from M. Newman
http://www-personal.umich.edu/~mejn/netdata/

The graph football contains the network of American football games
between Division IA colleges during regular season Fall 2000, as compiled
by M. Girvan and M. Newman.  The nodes have values that indicate to which
conferences they belong.  The values are as follows:

  0 = Atlantic Coast
  1 = Big East
  2 = Big Ten
  3 = Big Twelve
  4 = Conference USA
  5 = Independents
  6 = Mid-American
  7 = Mountain West
  8 = Pacific Ten
  9 = Southeastern
 10 = Sun Belt
 11 = Western Athletic

If you make use of these data, please cite M. Girvan and M. E. J. Newman,
Community structure in social and biological networks,
Proc. Natl. Acad. Sci. USA 99, 7821-7826 (2002).
| SVD-based statistics: | |
| norm(A) | 10.833 |
| min(svd(A)) | 0.0290007 |
| cond(A) | 373.543 |
| rank(A) | 115 |
| null space dimension | 0 |
| full numerical rank? | yes |
| singular values (MAT file): | click here |
| SVD method used: | s = svd (full (A)) ; |
| status: | ok |
For a description of the statistics displayed above, click here.
Maintained by Tim Davis, last updated 12-Mar-2014.
Matrix pictures by cspy, a MATLAB function in the CSparse package.
Matrix graphs by Yifan Hu, AT&T Labs Visualization Group.