Matrix: Moqri/MISKnowledgeMap
Description: document similarity graph
|
| (undirected graph drawing) |
 |
| Matrix properties | |
| number of rows | 2,427 |
| number of columns | 2,427 |
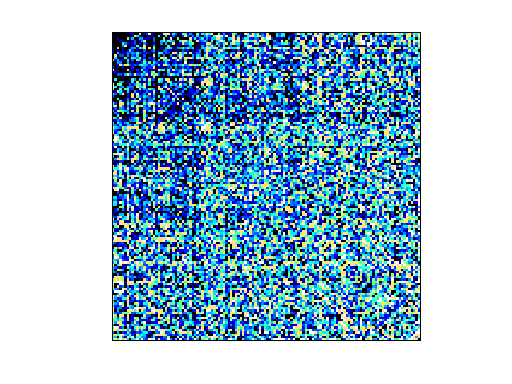
| nonzeros | 57,022 |
| # strongly connected comp. | 1 |
| explicit zero entries | 0 |
| nonzero pattern symmetry | symmetric |
| numeric value symmetry | symmetric |
| type | real |
| structure | symmetric |
| Cholesky candidate? | no |
| positive definite? | no |
| author | M. Moqri |
| editor | T. Davis |
| date | 2015 |
| kind | undirected weighted graph |
| 2D/3D problem? | no |
| Additional fields | size and type |
| Label | full 2427-by-204 |
| Year | full 2427-by-1 |
| Source | full 2427-by-50 |
| Authors | full 2427-by-351 |
| Keywords | full 2427-by-330 |
| Topics | full 2427-by-268 |
| Abstract | cell 2427-by-1 |
| CiteCnt | full 2427-by-1 |
Notes:
KnowledgeMap -- Visualizing Invisible Networks of Knowledge
in a Scientific Discipline, by M. Moqri, Univ of Florida,
Warrington College of Business Administration.
http://misknowledgemap.warrington.ufl.edu/
http://www.moqri.com/

This undirected wieghted graph describes the similarities
between a set of 2427 articles.  A(i,j) is 0 if articles
i and j are not similar at all, 1 if they are extremely
similar.  The similarity metric is based on LSA, co-citation,
and bibliographic coupling of the articles.  Information
about each node is as follows:

label: the title of the document                    (text)
year: year published (ranges from 2005 to 2014)     (number)
source: journal                                     (text)
authors: list of authors                            (text)
keywords: list of keywords separated by semicolons  (text)
topics: list of keywords separated by semicolons    (text)
abstract:                                           (text)
times cited:                                        (number)
For a description of the statistics displayed above, click here.
Maintained by Tim Davis, last updated 04-Jun-2015.
Matrix pictures by cspy, a MATLAB function in the CSparse package.
Matrix graphs by Yifan Hu, AT&T Labs Visualization Group.