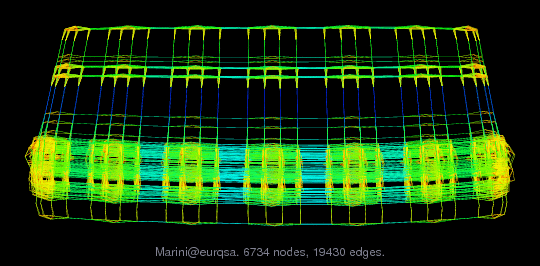
Matrix: Marini/eurqsa
Description: Economic time series reconciliation; Di Fonzo (Univ Padua) & Marini (ISTAT)
|
| (undirected graph drawing) |
 |
 |
 |
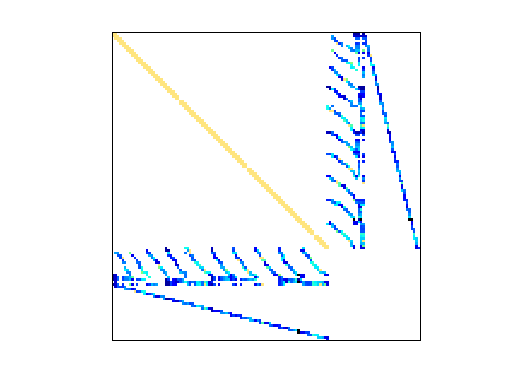
| Matrix properties | |
| number of rows | 7,245 |
| number of columns | 7,245 |
| nonzeros | 46,142 |
| structural full rank? | yes |
| structural rank | 7,245 |
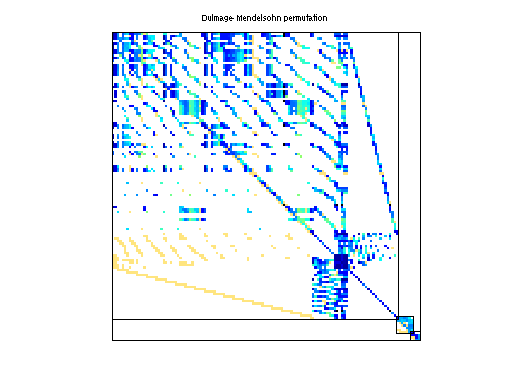
| # of blocks from dmperm | 3 |
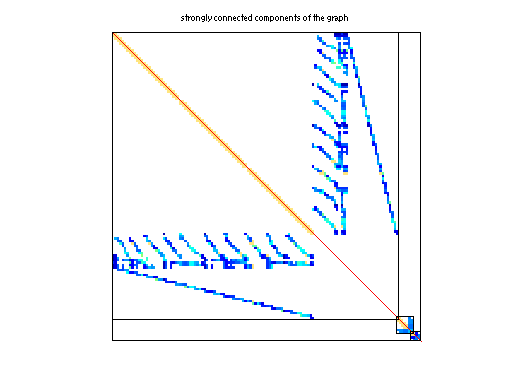
| # strongly connected comp. | 3 |
| explicit zero entries | 0 |
| nonzero pattern symmetry | symmetric |
| numeric value symmetry | symmetric |
| type | real |
| structure | symmetric |
| Cholesky candidate? | no |
| positive definite? | no |
| author | T. Di Fonzo, M. Marini |
| editor | T. Davis |
| date | 2008 |
| kind | economic problem |
| 2D/3D problem? | no |
| Additional fields | size and type |
| b | full 7245-by-1 |
Notes:
Economic statistics are often published in the form of time series, as a
collection of observations sampled at equally-spaced time periods (months,
quarters). Economic concepts behind such statistics are often linked by a
system of linear relationships, deriving from the economic theory. However,
these restrictions are rarely met by the original time series for various
reasons.  Then, data sets of real-world variables generally show
discrepancies with respect to prior restrictions on their values.  The
adjustment of a set of data in order to satisfy a number of accounting
restrictions -and thus to remove any discrepancy -is generally known as
the reconciliation problem.

The matrix comes from a real application composed of 183 quarterly time
series observed over 28 quarters, which form the system of European
national accounts by institutional sectors (EURQSA). Then, the number of
observations to be reconciled is n = 28 x 183 = 5124. The variables are
connected by a system of 30 linear relationships. Moreover, each quarterly
time series must be in line with the same variables observed yearly (due
to different compilation practices quarterly and annual estimates might
differ). The total number of constraints of the system is k = 2121. On
the whole, matrix A has dimension 7245, with block (1,1) of dimension 5124.
| Ordering statistics: | result |
| nnz(chol(P*(A+A'+s*I)*P')) with AMD | 153,155 |
| Cholesky flop count | 1.3e+07 |
| nnz(L+U), no partial pivoting, with AMD | 299,065 |
| nnz(V) for QR, upper bound nnz(L) for LU, with COLAMD | 1,174,854 |
| nnz(R) for QR, upper bound nnz(U) for LU, with COLAMD | 2,203,468 |
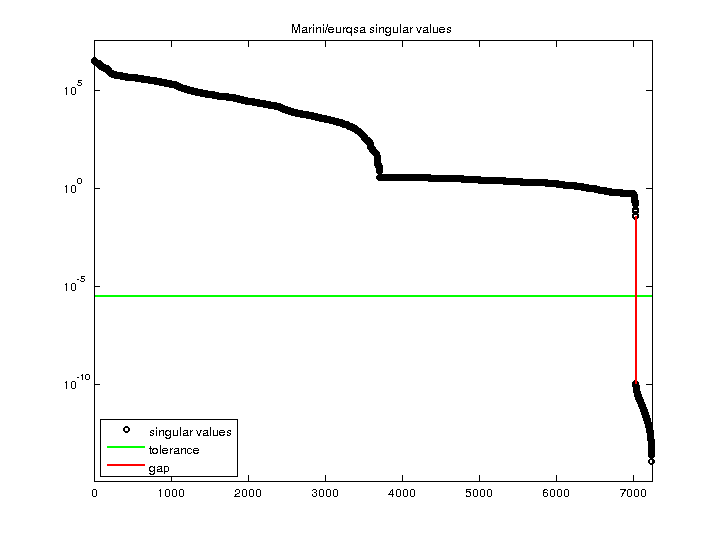
| SVD-based statistics: | |
| norm(A) | 3.47577e+06 |
| min(svd(A)) | 1.23888e-14 |
| cond(A) | 2.80557e+20 |
| rank(A) | 7,035 |
| sprank(A)-rank(A) | 210 |
| null space dimension | 210 |
| full numerical rank? | no |
| singular value gap | 3.03054e+08 |
| singular values (MAT file): | click here |
| SVD method used: | s = svd (full (A)) ; |
| status: | ok |
For a description of the statistics displayed above, click here.
Maintained by Tim Davis, last updated 12-Mar-2014.
Matrix pictures by cspy, a MATLAB function in the CSparse package.
Matrix graphs by Yifan Hu, AT&T Labs Visualization Group.