Matrix: Lourakis/bundle1
Description: Sparse bundle adjustment, 3D vision, M. Lourakis, Greece
|
| (undirected graph drawing) |
 |
| Matrix properties | |
| number of rows | 10,581 |
| number of columns | 10,581 |
| nonzeros | 770,811 |
| structural full rank? | yes |
| structural rank | 10,581 |
| # of blocks from dmperm | 1 |
| # strongly connected comp. | 1 |
| explicit zero entries | 90 |
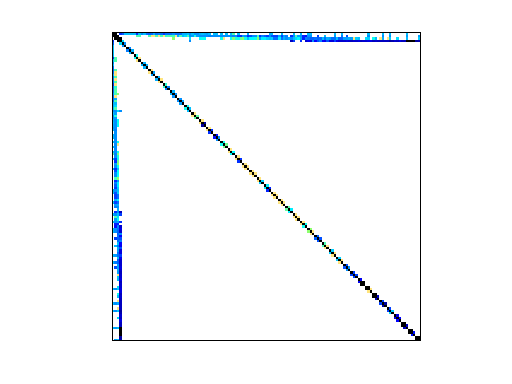
| nonzero pattern symmetry | symmetric |
| numeric value symmetry | symmetric |
| type | real |
| structure | symmetric |
| Cholesky candidate? | yes |
| positive definite? | yes |
| author | M. Lourakis |
| editor | T. Davis |
| date | 2006 |
| kind | computer graphics/vision problem |
| 2D/3D problem? | yes |
| Ordering statistics: | result |
| nnz(chol(P*(A+A'+s*I)*P')) with AMD | 460,630 |
| Cholesky flop count | 3.9e+07 |
| nnz(L+U), no partial pivoting, with AMD | 910,679 |
| nnz(V) for QR, upper bound nnz(L) for LU, with COLAMD | 3,811,882 |
| nnz(R) for QR, upper bound nnz(U) for LU, with COLAMD | 38,413,165 |
Note that all matrix statistics (except nonzero pattern symmetry) exclude the 90 explicit zero entries.
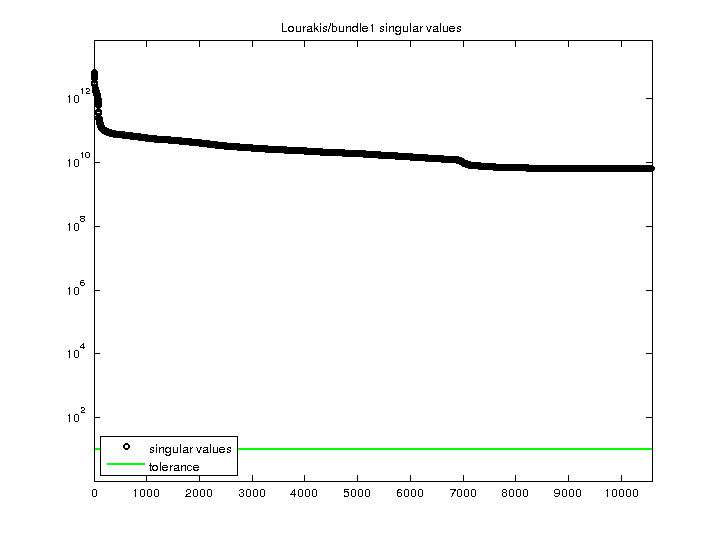
| SVD-based statistics: | |
| norm(A) | 6.429e+12 |
| min(svd(A)) | 6.40186e+09 |
| cond(A) | 1004.24 |
| rank(A) | 10,581 |
| sprank(A)-rank(A) | 0 |
| null space dimension | 0 |
| full numerical rank? | yes |
| singular values (MAT file): | click here |
| SVD method used: | s = svd (full (A)) ; |
| status: | ok |
For a description of the statistics displayed above, click here.
Maintained by Tim Davis, last updated 12-Mar-2014.
Matrix pictures by cspy, a MATLAB function in the CSparse package.
Matrix graphs by Yifan Hu, AT&T Labs Visualization Group.