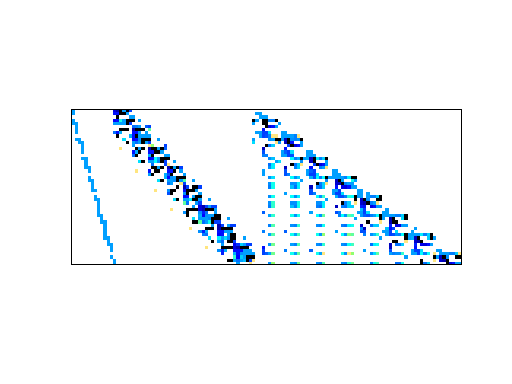
Matrix: LPnetlib/lp_pilotnov
Description: Netlib LP problem pilotnov: minimize c'*x, where Ax=b, lo<=x<=hi
|
| (bipartite graph drawing) |
 |
 |
| Matrix properties | |
| number of rows | 975 |
| number of columns | 2,446 |
| nonzeros | 13,331 |
| structural full rank? | yes |
| structural rank | 975 |
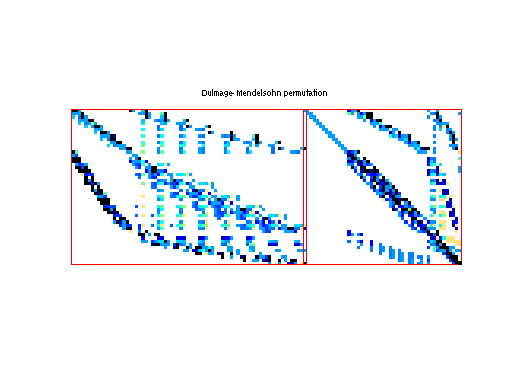
| # of blocks from dmperm | 3 |
| # strongly connected comp. | 1 |
| explicit zero entries | 0 |
| nonzero pattern symmetry | 0% |
| numeric value symmetry | 0% |
| type | real |
| structure | rectangular |
| Cholesky candidate? | no |
| positive definite? | no |
| author | Stanford |
| editor | R. Fourer |
| date | 1989 |
| kind | linear programming problem |
| 2D/3D problem? | no |
| Additional fields | size and type |
| b | full 975-by-1 |
| c | full 2446-by-1 |
| lo | full 2446-by-1 |
| hi | full 2446-by-1 |
| z0 | full 1-by-1 |
Notes:
A Netlib LP problem, in lp/data.  For more information
send email to netlib@ornl.gov with the message:

	 send index from lp
	 send readme from lp/data

The following are relevant excerpts from lp/data/readme (by David M. Gay):

The column and nonzero counts in the PROBLEM SUMMARY TABLE below exclude
slack and surplus columns and the right-hand side vector, but include
the cost row.  We have omitted other free rows and all but the first
right-hand side vector, as noted below.  The byte count is for the
MPS compressed file; it includes a newline character at the end of each
line.  These files start with a blank initial line intended to prevent
mail programs from discarding any of the data.  The BR column indicates
whether a problem has bounds or ranges:  B stands for "has bounds", R
for "has ranges".  The BOUND-TYPE TABLE below shows the bound types
present in those problems that have bounds.

The optimal value is from MINOS version 5.3 (of Sept. 1988)
running on a VAX with default options.

                       PROBLEM SUMMARY TABLE

Name       Rows   Cols   Nonzeros    Bytes  BR      Optimal Value
PILOTNOV    976   2172    13129      89779  B    -4.4972761882E+03

        BOUND-TYPE TABLE
PILOTNOV   UP    FX

Supplied by Bob Fourer.
When included in Netlib: Cost coefficients negated.
Prior to 29 April 1987, the lp/data/readme file gave the optimal value
from maximizing rather than minimizing PILOTNOV.

Source for PILOT.JA, PILOT.WE, PILOT4, PILOTNOV: Systems Optimization
Laboratory, Stanford University.
| Ordering statistics: | result |
| nnz(V) for QR, upper bound nnz(L) for LU, with COLAMD | 331,241 |
| nnz(R) for QR, upper bound nnz(U) for LU, with COLAMD | 55,648 |
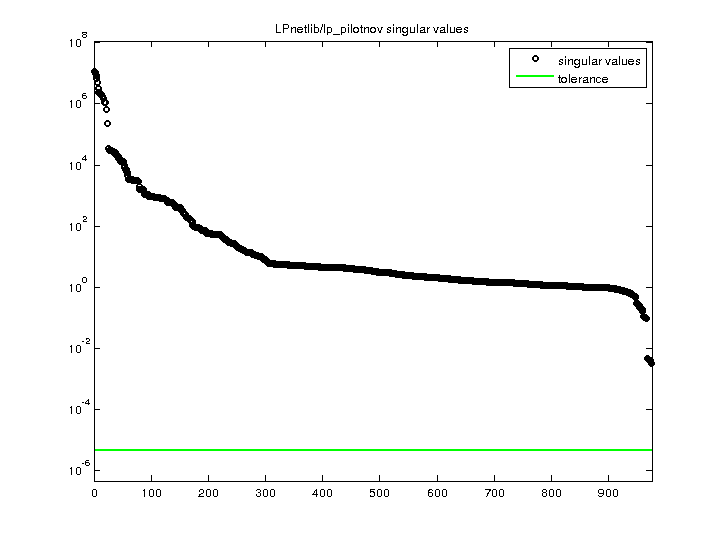
| SVD-based statistics: | |
| norm(A) | 1.15045e+07 |
| min(svd(A)) | 0.00318646 |
| cond(A) | 3.61043e+09 |
| rank(A) | 975 |
| sprank(A)-rank(A) | 0 |
| null space dimension | 0 |
| full numerical rank? | yes |
| singular values (MAT file): | click here |
| SVD method used: | s = svd (full (A)) ; |
| status: | ok |
For a description of the statistics displayed above, click here.
Maintained by Tim Davis, last updated 12-Mar-2014.
Matrix pictures by cspy, a MATLAB function in the CSparse package.
Matrix graphs by Yifan Hu, AT&T Labs Visualization Group.