Matrix: Hollinger/mark3jac080sc
Description: Jacobian from MULTIMOD Mark3, oldstack 080 (scaled)
|
|
| (bipartite graph drawing) | (graph drawing of A+A') |
 |
 |
 |
| Matrix properties | |
| number of rows | 36,609 |
| number of columns | 36,609 |
| nonzeros | 214,643 |
| structural full rank? | yes |
| structural rank | 36,609 |
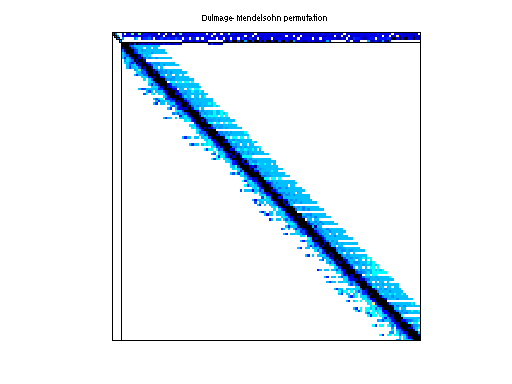
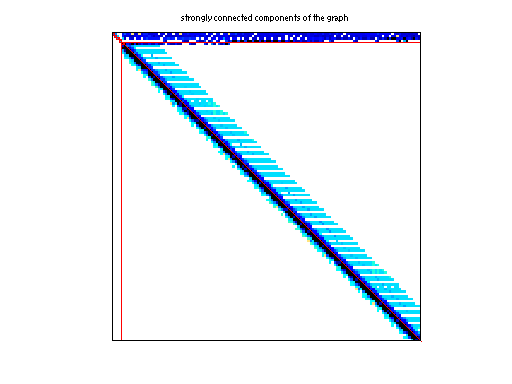
| # of blocks from dmperm | 1,281 |
| # strongly connected comp. | 1,281 |
| explicit zero entries | 13,312 |
| nonzero pattern symmetry | 7% |
| numeric value symmetry | 1% |
| type | real |
| structure | unsymmetric |
| Cholesky candidate? | no |
| positive definite? | no |
| author | P. Hollinger |
| editor | T. Davis |
| date | 2001 |
| kind | economic problem |
| 2D/3D problem? | no |
| Ordering statistics: | result |
| nnz(chol(P*(A+A'+s*I)*P')) with AMD | 7,577,614 |
| Cholesky flop count | 6.8e+09 |
| nnz(L+U), no partial pivoting, with AMD | 15,118,619 |
| nnz(V) for QR, upper bound nnz(L) for LU, with COLAMD | 12,194,688 |
| nnz(R) for QR, upper bound nnz(U) for LU, with COLAMD | 21,146,676 |
Note that all matrix statistics (except nonzero pattern symmetry) exclude the 13312 explicit zero entries.
| SVD-based statistics: | |
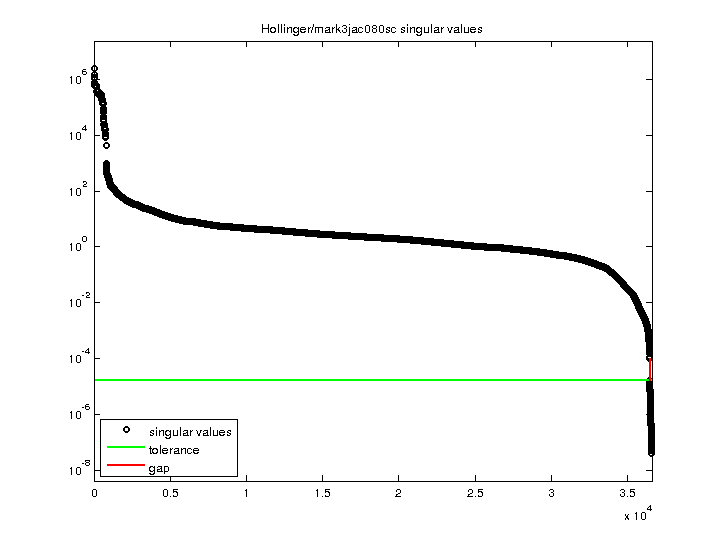
| norm(A) | 2.34469e+06 |
| min(svd(A)) | 4.1623e-08 |
| cond(A) | 5.63315e+13 |
| rank(A) | 36,451 |
| sprank(A)-rank(A) | 158 |
| null space dimension | 158 |
| full numerical rank? | no |
| singular value gap | 5.96981 |
| singular values (MAT file): | click here |
| SVD method used: | s = svd (full (A)) |
| status: | ok |
For a description of the statistics displayed above, click here.
Maintained by Tim Davis, last updated 12-Mar-2014.
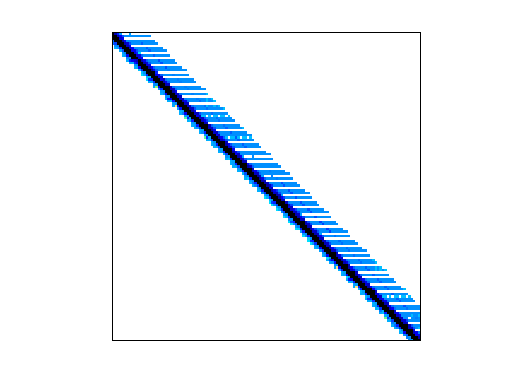
Matrix pictures by cspy, a MATLAB function in the CSparse package.
Matrix graphs by Yifan Hu, AT&T Labs Visualization Group.