Matrix: Hollinger/jan99jac020
Description: Jacobian from Bank of Canada 'jan99' model, oldstack 020
|
|
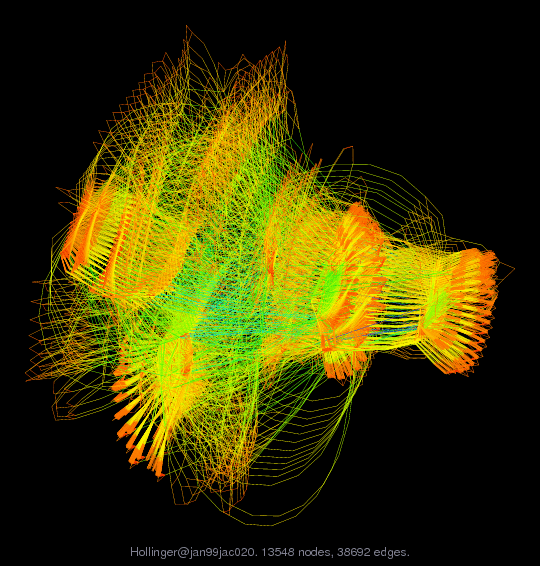
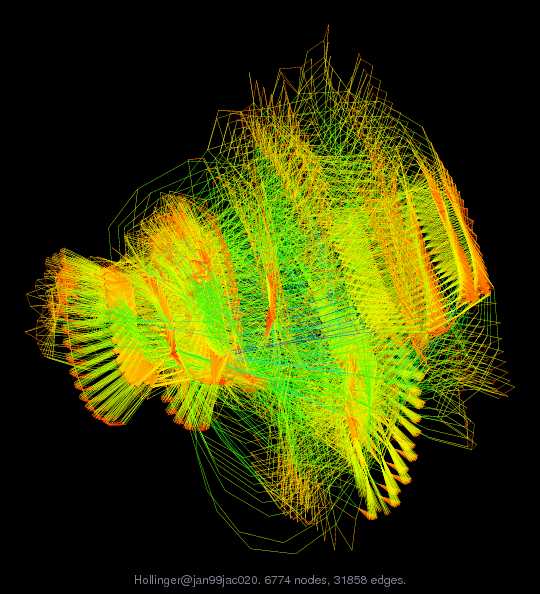
| (bipartite graph drawing) | (graph drawing of A+A') |
 |
 |
 |
| Matrix properties | |
| number of rows | 6,774 |
| number of columns | 6,774 |
| nonzeros | 33,744 |
| structural full rank? | yes |
| structural rank | 6,774 |
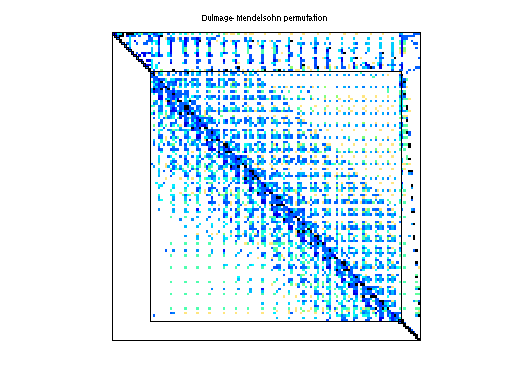
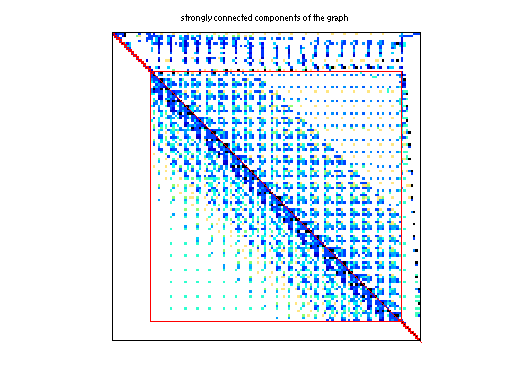
| # of blocks from dmperm | 1,311 |
| # strongly connected comp. | 1,291 |
| explicit zero entries | 4,948 |
| nonzero pattern symmetry | 0% |
| numeric value symmetry | 0% |
| type | real |
| structure | unsymmetric |
| Cholesky candidate? | no |
| positive definite? | no |
| author | P. Hollinger |
| editor | T. Davis |
| date | 2001 |
| kind | economic problem |
| 2D/3D problem? | no |
| Additional fields | size and type |
| b | full 6774-by-1 |
| x | full 6774-by-1 |
| Ordering statistics: | result |
| nnz(chol(P*(A+A'+s*I)*P')) with AMD | 198,431 |
| Cholesky flop count | 3.7e+07 |
| nnz(L+U), no partial pivoting, with AMD | 390,088 |
| nnz(V) for QR, upper bound nnz(L) for LU, with COLAMD | 233,673 |
| nnz(R) for QR, upper bound nnz(U) for LU, with COLAMD | 603,053 |
Note that all matrix statistics (except nonzero pattern symmetry) exclude the 4948 explicit zero entries.
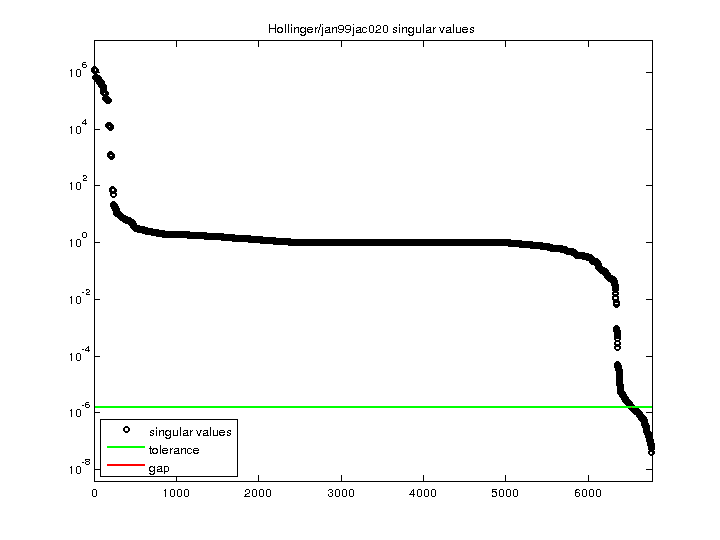
| SVD-based statistics: | |
| norm(A) | 1.26547e+06 |
| min(svd(A)) | 3.97085e-08 |
| cond(A) | 3.18689e+13 |
| rank(A) | 6,525 |
| sprank(A)-rank(A) | 249 |
| null space dimension | 249 |
| full numerical rank? | no |
| singular value gap | 1.0016 |
| singular values (MAT file): | click here |
| SVD method used: | s = svd (full (A)) ; |
| status: | ok |
For a description of the statistics displayed above, click here.
Maintained by Tim Davis, last updated 12-Mar-2014.
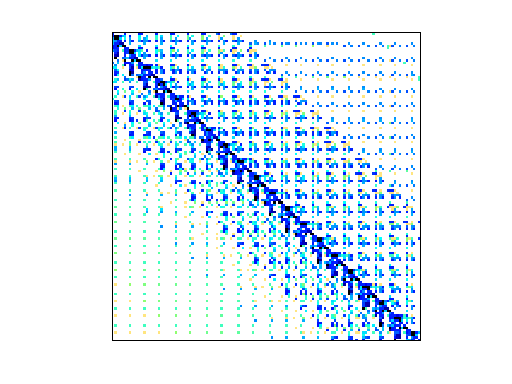
Matrix pictures by cspy, a MATLAB function in the CSparse package.
Matrix graphs by Yifan Hu, AT&T Labs Visualization Group.