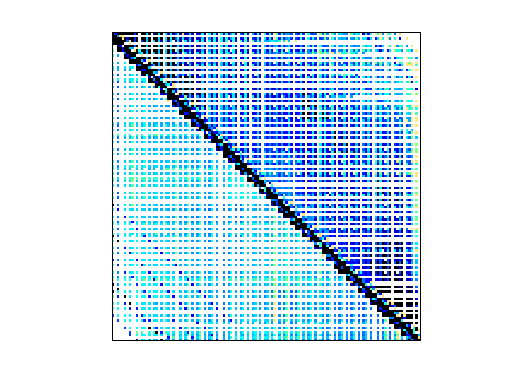
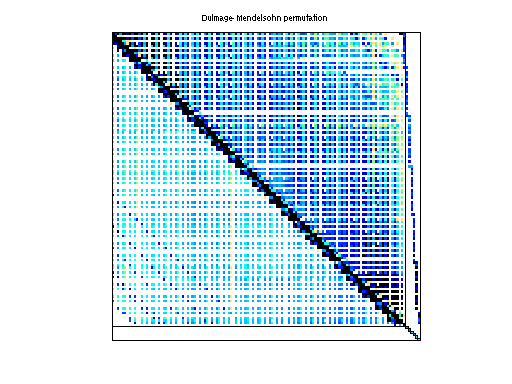
Matrix: Hollinger/g7jac050sc
Description: Jacobian from CEPII's 'G7marmotte' OLG model, oldstack 050 (scaled)
|
|
| (bipartite graph drawing) | (graph drawing of A+A') |
 |
 |
 |
| Matrix properties | |
| number of rows | 14,760 |
| number of columns | 14,760 |
| nonzeros | 145,157 |
| structural full rank? | yes |
| structural rank | 14,760 |
| # of blocks from dmperm | 737 |
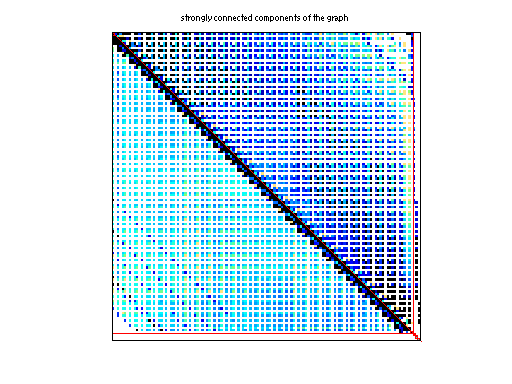
| # strongly connected comp. | 387 |
| explicit zero entries | 12,833 |
| nonzero pattern symmetry | 4% |
| numeric value symmetry | 0% |
| type | real |
| structure | unsymmetric |
| Cholesky candidate? | no |
| positive definite? | no |
| author | P. Hollinger |
| editor | T. Davis |
| date | 2001 |
| kind | economic problem |
| 2D/3D problem? | no |
| Ordering statistics: | result |
| nnz(chol(P*(A+A'+s*I)*P')) with AMD | 2,788,451 |
| Cholesky flop count | 2.4e+09 |
| nnz(L+U), no partial pivoting, with AMD | 5,562,142 |
| nnz(V) for QR, upper bound nnz(L) for LU, with COLAMD | 2,898,238 |
| nnz(R) for QR, upper bound nnz(U) for LU, with COLAMD | 5,399,522 |
Note that all matrix statistics (except nonzero pattern symmetry) exclude the 12833 explicit zero entries.
| SVD-based statistics: | |
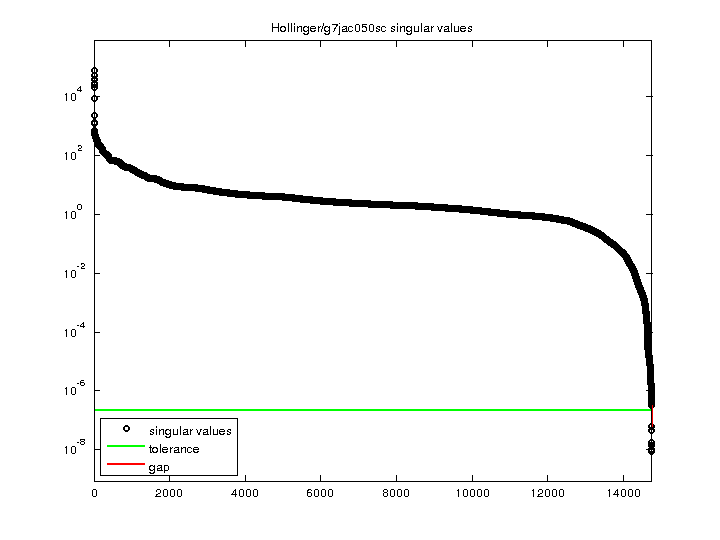
| norm(A) | 79999.9 |
| min(svd(A)) | 8.55193e-09 |
| cond(A) | 9.35461e+12 |
| rank(A) | 14,754 |
| sprank(A)-rank(A) | 6 |
| null space dimension | 6 |
| full numerical rank? | no |
| singular value gap | 5.15442 |
| singular values (MAT file): | click here |
| SVD method used: | s = svd (full (A)) ; |
| status: | ok |
For a description of the statistics displayed above, click here.
Maintained by Tim Davis, last updated 12-Mar-2014.
Matrix pictures by cspy, a MATLAB function in the CSparse package.
Matrix graphs by Yifan Hu, AT&T Labs Visualization Group.