Matrix: Harvard_Seismology/JP
Description: Earth's crust underneath Japan, Harvard Seismology Group
|
| (bipartite graph drawing) |
 |
 |
 |
| Matrix properties | |
| number of rows | 87,616 |
| number of columns | 67,320 |
| nonzeros | 13,734,559 |
| structural full rank? | no |
| structural rank | 26,137 |
| # of blocks from dmperm | 254 |
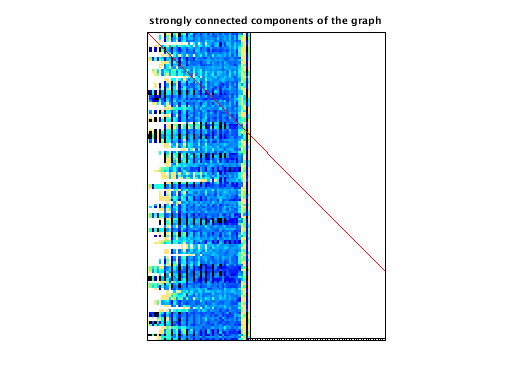
| # strongly connected comp. | 38,201 |
| explicit zero entries | 0 |
| nonzero pattern symmetry | 0% |
| numeric value symmetry | 0% |
| type | real |
| structure | rectangular |
| Cholesky candidate? | no |
| positive definite? | no |
| author | P. Bogiatzis, M. Ishii |
| editor | T. Davis |
| date | 2015 |
| kind | tomography problem |
| 2D/3D problem? | no |
Notes:
Earth's crust underneath Japan, Harvard Seismology Group.
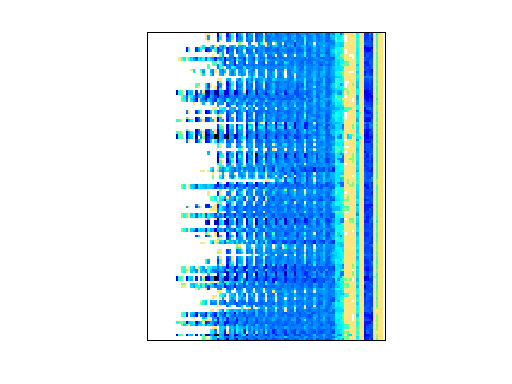
This matrix represents the forward operator of a linearized seismic
tomography problem for imaging Japan's crust and upper mantle. The
rows of the matrix correspond to 87,616 P-wave ray paths, from 125
moderate size earthquakes (stars), deeper that ~150 km that occurred
the last decade, and recorded from seismic stations of the Hi-net
array (triangles). The 3-Dimensional space is parameterized using a
grid of 67,320 parameters that correspond to the columns of the matrix.
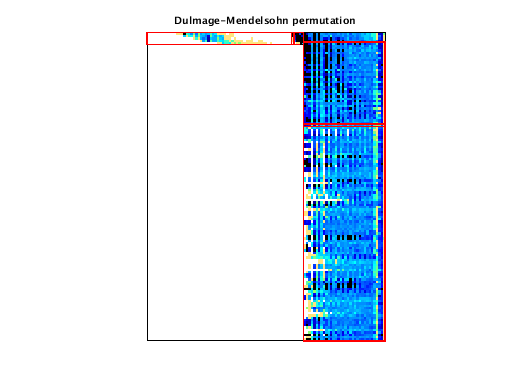
The matrix is structurally and numerically rank deficient. This is
because some parts of the Earth are not imaged well from the data,
due to the lack of signals (earthquakes) and receivers (seismic stations
in those areas. This leads to an under-determined part of the system.
Other parts of the problem are overdetermined, because deep earthquakes
repeat in the same region of the Earth, over time, and the seismic
stations do not move. Repeated earthquakes from the same source
are recorded by the same seismic stations, leading to an over-
determined problem for those regions of the Earth.
In MATLAB, cs_dmspy(Problem.A) displays these two parts of the matrix,
using a function from CSparse, available at http://suitesparse.com.
Petros Bogiatzis, Miaki Ishii, Harvard Seismology Group, 2015
http://www.seismology.harvard.edu
Bogiatzis, P., & Ishii, M., 2014. Resolution Analysis and Jointly
Inverted P-and S-Wave Models of Japan's Crust and Upper Mantle.
American Geophysical Union, Fall Meeting 2014, S33A-4501.
For a description of the statistics displayed above, click here.
Maintained by Tim Davis, last updated 15-Jul-2015.
Matrix pictures by cspy, a MATLAB function in the CSparse package.
Matrix graphs by Yifan Hu, AT&T Labs Visualization Group.