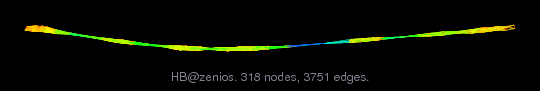
Matrix: HB/zenios
Description: S AIR-TRAFFIC CONTROL MODEL BY STAVROS A. ZENIOS
|
| (undirected graph drawing) |
 |
 |
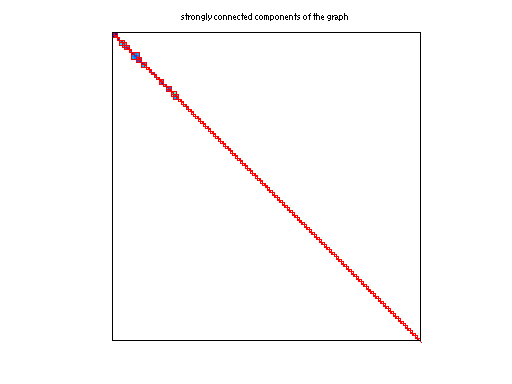 |
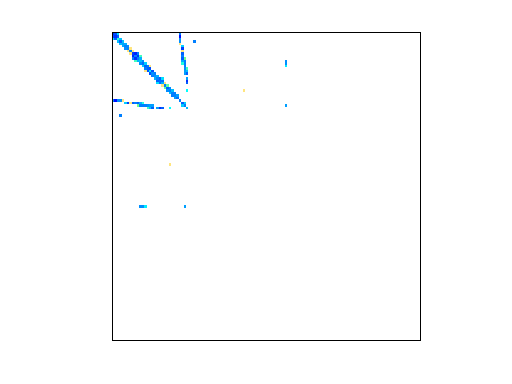
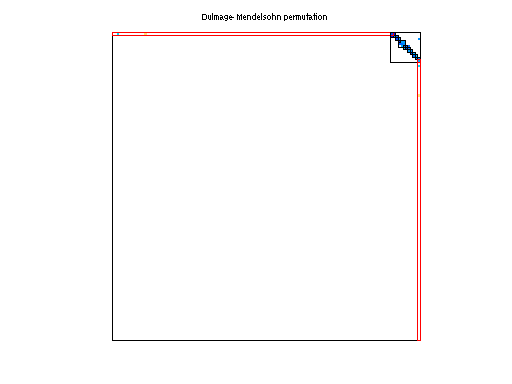
| Matrix properties | |
| number of rows | 2,873 |
| number of columns | 2,873 |
| nonzeros | 1,314 |
| structural full rank? | no |
| structural rank | 266 |
| # of blocks from dmperm | 84 |
| # strongly connected comp. | 2,650 |
| explicit zero entries | 25,877 |
| nonzero pattern symmetry | symmetric |
| numeric value symmetry | symmetric |
| type | real |
| structure | symmetric |
| Cholesky candidate? | no |
| positive definite? | no |
| author | S. Zenios |
| editor | I. Duff, R. Grimes, J. Lewis |
| date | 1985 |
| kind | optimization problem |
| 2D/3D problem? | no |
| Ordering statistics: | result |
| nnz(chol(P*(A+A'+s*I)*P')) with AMD | 3,546 |
| Cholesky flop count | 7.3e+03 |
| nnz(L+U), no partial pivoting, with AMD | 4,219 |
| nnz(V) for QR, upper bound nnz(L) for LU, with COLAMD | 3,507 |
| nnz(R) for QR, upper bound nnz(U) for LU, with COLAMD | 3,862 |
Note that all matrix statistics (except nonzero pattern symmetry) exclude the 25877 explicit zero entries.
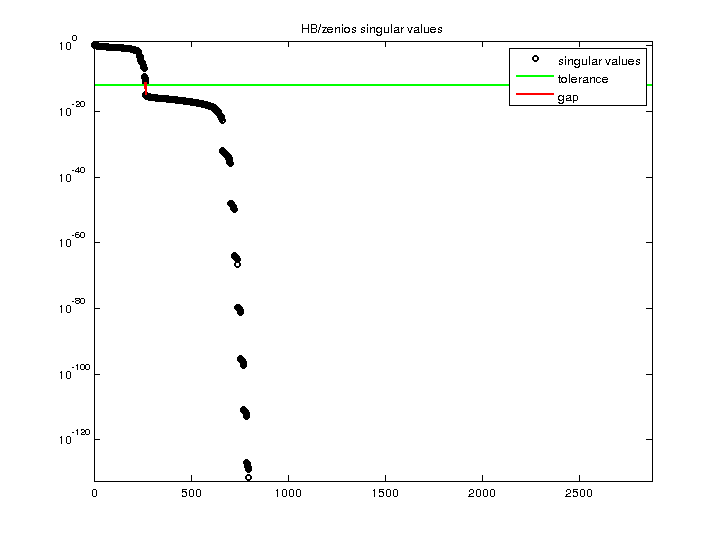
| SVD-based statistics: | |
| norm(A) | 3.33795 |
| min(svd(A)) | 0 |
| cond(A) | Inf |
| rank(A) | 265 |
| sprank(A)-rank(A) | 1 |
| null space dimension | 2,608 |
| full numerical rank? | no |
| singular value gap | 5827.89 |
| singular values (MAT file): | click here |
| SVD method used: | s = svd (full (A)) ; |
| status: | ok |
For a description of the statistics displayed above, click here.
Maintained by Tim Davis, last updated 12-Mar-2014.
Matrix pictures by cspy, a MATLAB function in the CSparse package.
Matrix graphs by Yifan Hu, AT&T Labs Visualization Group.