Matrix: HB/sherman5
Description: U FULLY IMPLICIT BLACK OIL SIMULATOR 16 BY 23 BY 3 GRID, THREE UNK
|
|
| (bipartite graph drawing) | (graph drawing of A+A') |
 |
 |
| Matrix properties | |
| number of rows | 3,312 |
| number of columns | 3,312 |
| nonzeros | 20,793 |
| structural full rank? | yes |
| structural rank | 3,312 |
| # of blocks from dmperm | 1,675 |
| # strongly connected comp. | 1,675 |
| explicit zero entries | 0 |
| nonzero pattern symmetry | 74% |
| numeric value symmetry | 15% |
| type | real |
| structure | unsymmetric |
| Cholesky candidate? | no |
| positive definite? | no |
| author | A. Sherman |
| editor | I. Duff, R. Grimes, J. Lewis |
| date | 1984 |
| kind | computational fluid dynamics problem |
| 2D/3D problem? | yes |
| Additional fields | size and type |
| b | full 3312-by-1 |
| Ordering statistics: | result |
| nnz(chol(P*(A+A'+s*I)*P')) with AMD | 78,567 |
| Cholesky flop count | 6.1e+06 |
| nnz(L+U), no partial pivoting, with AMD | 153,822 |
| nnz(V) for QR, upper bound nnz(L) for LU, with COLAMD | 94,649 |
| nnz(R) for QR, upper bound nnz(U) for LU, with COLAMD | 189,297 |
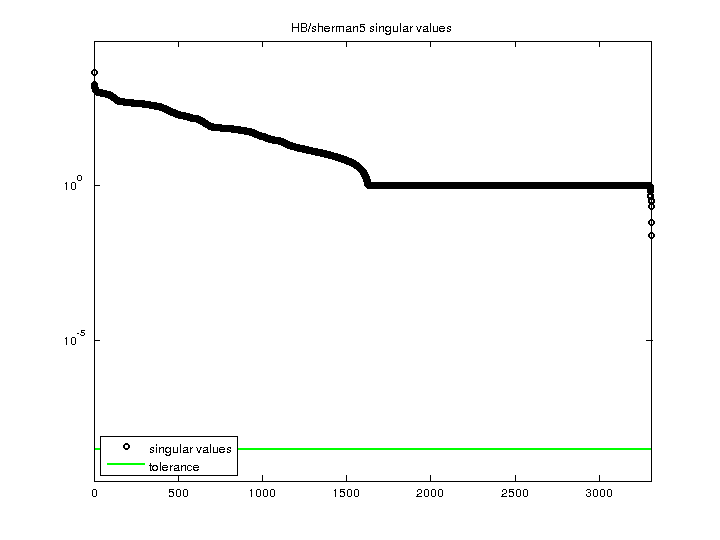
| SVD-based statistics: | |
| norm(A) | 4547.51 |
| min(svd(A)) | 0.0241965 |
| cond(A) | 187941 |
| rank(A) | 3,312 |
| sprank(A)-rank(A) | 0 |
| null space dimension | 0 |
| full numerical rank? | yes |
| singular values (MAT file): | click here |
| SVD method used: | s = svd (full (A)) ; |
| status: | ok |
For a description of the statistics displayed above, click here.
Maintained by Tim Davis, last updated 12-Mar-2014.
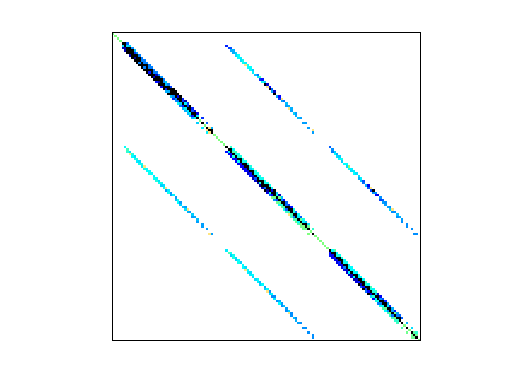
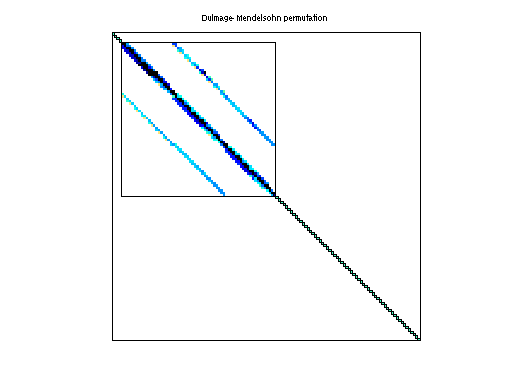
Matrix pictures by cspy, a MATLAB function in the CSparse package.
Matrix graphs by Yifan Hu, AT&T Labs Visualization Group.