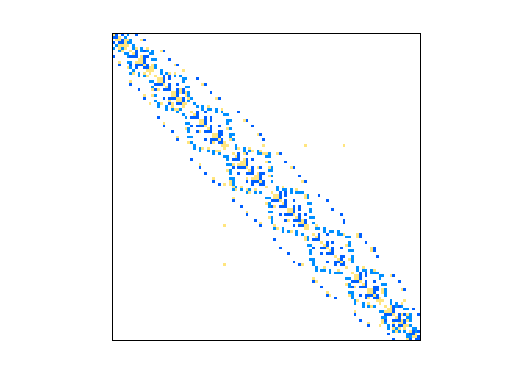
Matrix: HB/nnc666
Description: U NATIONAL NUCLEAR CORP. FISSION REACTOR SIESMIC STUDIES
|
|
| (bipartite graph drawing) | (graph drawing of A+A') |
 |
 |
| Matrix properties | |
| number of rows | 666 |
| number of columns | 666 |
| nonzeros | 4,032 |
| structural full rank? | yes |
| structural rank | 666 |
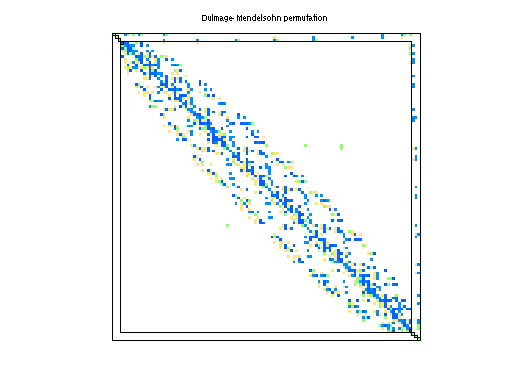
| # of blocks from dmperm | 41 |
| # strongly connected comp. | 1 |
| explicit zero entries | 12 |
| nonzero pattern symmetry | 82% |
| numeric value symmetry | 59% |
| type | real |
| structure | unsymmetric |
| Cholesky candidate? | no |
| positive definite? | no |
| author | National Nuclear Corp. |
| editor | I. Duff, R. Grimes, J. Lewis |
| date | 1982 |
| kind | 2D/3D problem |
| 2D/3D problem? | yes |
| Ordering statistics: | result |
| nnz(chol(P*(A+A'+s*I)*P')) with AMD | 5,786 |
| Cholesky flop count | 6.7e+04 |
| nnz(L+U), no partial pivoting, with AMD | 10,906 |
| nnz(V) for QR, upper bound nnz(L) for LU, with COLAMD | 12,485 |
| nnz(R) for QR, upper bound nnz(U) for LU, with COLAMD | 26,064 |
Note that all matrix statistics (except nonzero pattern symmetry) exclude the 12 explicit zero entries.
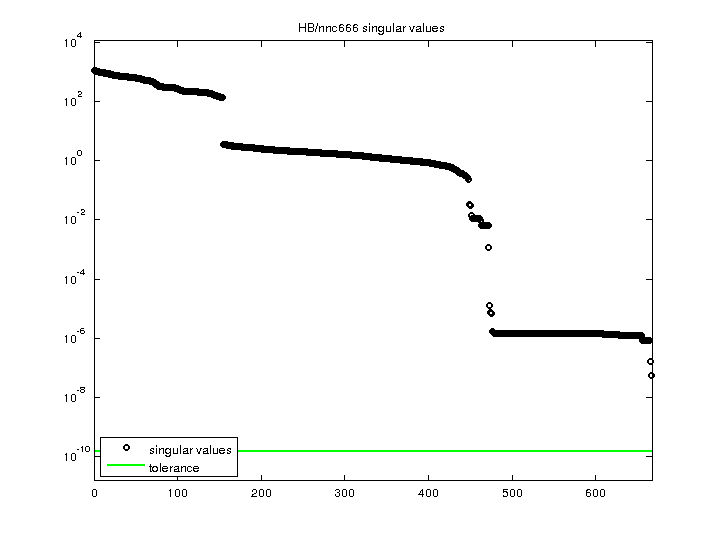
| SVD-based statistics: | |
| norm(A) | 1086.07 |
| min(svd(A)) | 5.31325e-08 |
| cond(A) | 2.04409e+10 |
| rank(A) | 666 |
| sprank(A)-rank(A) | 0 |
| null space dimension | 0 |
| full numerical rank? | yes |
| singular values (MAT file): | click here |
| SVD method used: | s = svd (full (A)) ; |
| status: | ok |
For a description of the statistics displayed above, click here.
Maintained by Tim Davis, last updated 12-Mar-2014.
Matrix pictures by cspy, a MATLAB function in the CSparse package.
Matrix graphs by Yifan Hu, AT&T Labs Visualization Group.