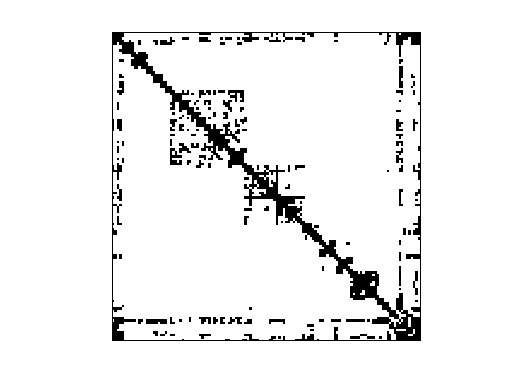
Matrix: GHS_psdef/ford1
Description: Gould, Hu, & Scott: car surface mesh, from Pothen & Kumfert
|
| (undirected graph drawing) |
 |
| Matrix properties | |
| number of rows | 18,728 |
| number of columns | 18,728 |
| nonzeros | 101,576 |
| structural full rank? | yes |
| structural rank | 18,728 |
| # of blocks from dmperm | 1 |
| # strongly connected comp. | 1 |
| explicit zero entries | 0 |
| nonzero pattern symmetry | symmetric |
| numeric value symmetry | symmetric |
| type | binary |
| structure | symmetric |
| Cholesky candidate? | yes |
| positive definite? | no |
| author | G. Kumfert, A. Pothen |
| editor | N. Gould, Y. Hu, J. Scott |
| date | 2004 |
| kind | structural problem |
| 2D/3D problem? | yes |
| Ordering statistics: | result |
| nnz(chol(P*(A+A'+s*I)*P')) with AMD | 303,615 |
| Cholesky flop count | 1.4e+07 |
| nnz(L+U), no partial pivoting, with AMD | 588,502 |
| nnz(V) for QR, upper bound nnz(L) for LU, with COLAMD | 652,845 |
| nnz(R) for QR, upper bound nnz(U) for LU, with COLAMD | 1,237,976 |
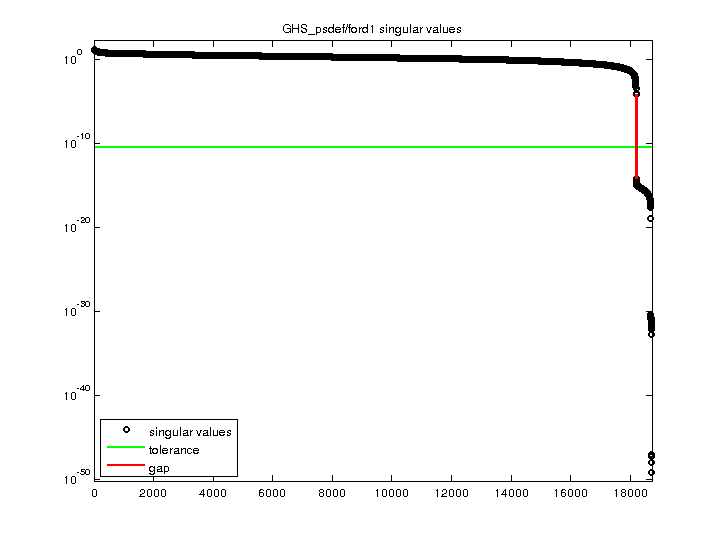
| SVD-based statistics: | |
| norm(A) | 13.9705 |
| min(svd(A)) | 7.19608e-50 |
| cond(A) | 1.94141e+50 |
| rank(A) | 18,194 |
| sprank(A)-rank(A) | 534 |
| null space dimension | 534 |
| full numerical rank? | no |
| singular value gap | 9.9064e+09 |
| singular values (MAT file): | click here |
| SVD method used: | s = svd (full (R)) ; where [~,R,E] = spqr (A) with droptol of zero |
| status: | ok |
For a description of the statistics displayed above, click here.
Maintained by Tim Davis, last updated 12-Mar-2014.
Matrix pictures by cspy, a MATLAB function in the CSparse package.
Matrix graphs by Yifan Hu, AT&T Labs Visualization Group.