Matrix: FIDAP/ex31
Description: TEST MATRIX FROM FIDAP: EX31.MAT
|
| (undirected graph drawing) |
 |
 |
 |
| Matrix properties | |
| number of rows | 3,909 |
| number of columns | 3,909 |
| nonzeros | 91,223 |
| structural full rank? | yes |
| structural rank | 3,909 |
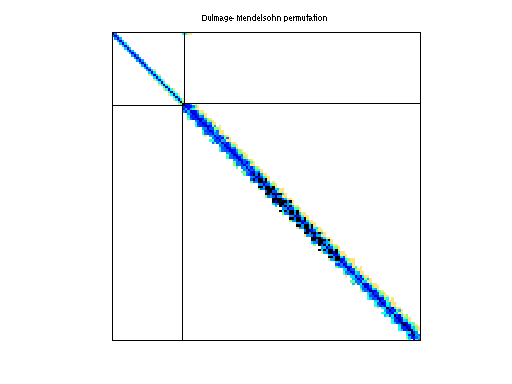
| # of blocks from dmperm | 2 |
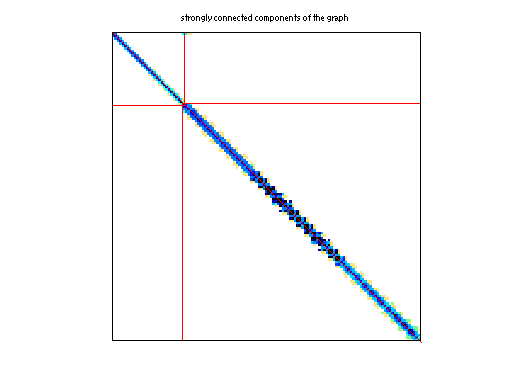
| # strongly connected comp. | 2 |
| explicit zero entries | 24,134 |
| nonzero pattern symmetry | symmetric |
| numeric value symmetry | 73% |
| type | real |
| structure | unsymmetric |
| Cholesky candidate? | no |
| positive definite? | no |
| author | A. Baggag, Y. Saad |
| editor | A. Baggag, Y. Saad |
| date | 1994 |
| kind | computational fluid dynamics problem |
| 2D/3D problem? | yes |
| Ordering statistics: | result |
| nnz(chol(P*(A+A'+s*I)*P')) with AMD | 127,797 |
| Cholesky flop count | 5.7e+06 |
| nnz(L+U), no partial pivoting, with AMD | 251,685 |
| nnz(V) for QR, upper bound nnz(L) for LU, with COLAMD | 320,164 |
| nnz(R) for QR, upper bound nnz(U) for LU, with COLAMD | 969,014 |
Note that all matrix statistics (except nonzero pattern symmetry) exclude the 24134 explicit zero entries.
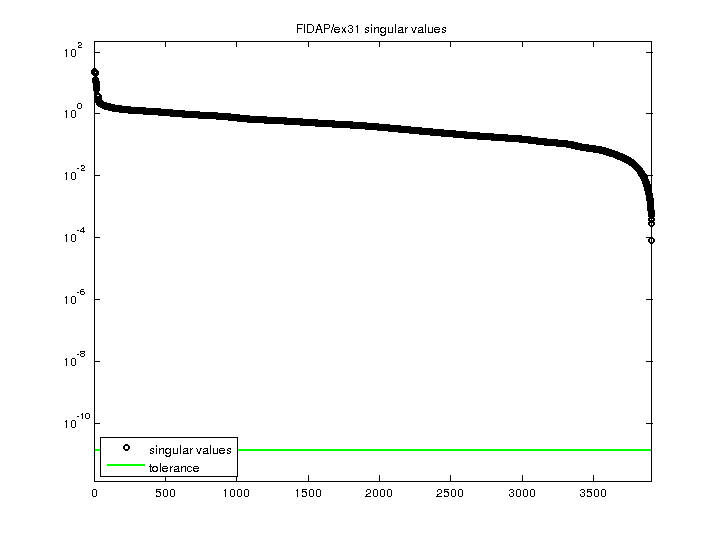
| SVD-based statistics: | |
| norm(A) | 22.7673 |
| min(svd(A)) | 7.93678e-05 |
| cond(A) | 286858 |
| rank(A) | 3,909 |
| sprank(A)-rank(A) | 0 |
| null space dimension | 0 |
| full numerical rank? | yes |
| singular values (MAT file): | click here |
| SVD method used: | s = svd (full (A)) ; |
| status: | ok |
For a description of the statistics displayed above, click here.
Maintained by Tim Davis, last updated 12-Mar-2014.
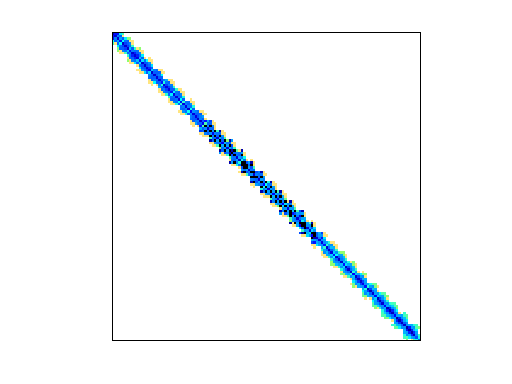
Matrix pictures by cspy, a MATLAB function in the CSparse package.
Matrix graphs by Yifan Hu, AT&T Labs Visualization Group.