Matrix: FEMLAB/ns3Da
Description: Comsol, Inc. www.femlab.com : 3D Navier Stokes
|
|
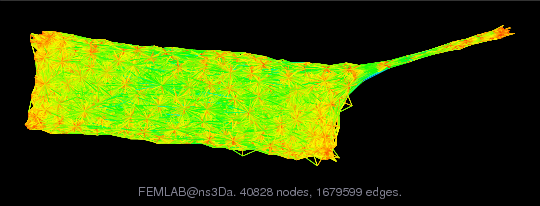
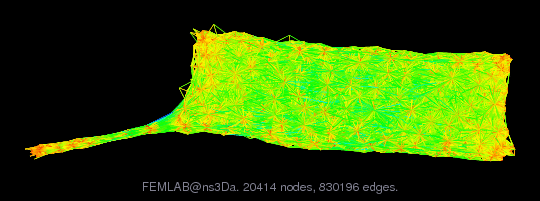
| (bipartite graph drawing) | (graph drawing of A+A') |
 |
| Matrix properties | |
| number of rows | 20,414 |
| number of columns | 20,414 |
| nonzeros | 1,679,599 |
| structural full rank? | yes |
| structural rank | 20,414 |
| # of blocks from dmperm | 1 |
| # strongly connected comp. | 1 |
| explicit zero entries | 0 |
| nonzero pattern symmetry | 100% |
| numeric value symmetry | 0% |
| type | real |
| structure | unsymmetric |
| Cholesky candidate? | no |
| positive definite? | no |
| author | COMSOL |
| editor | T. Davis |
| date | 2003 |
| kind | computational fluid dynamics problem |
| 2D/3D problem? | yes |
| Additional fields | size and type |
| b | full 20414-by-1 |
| Ordering statistics: | result |
| nnz(chol(P*(A+A'+s*I)*P')) with AMD | 8,910,507 |
| Cholesky flop count | 7.4e+09 |
| nnz(L+U), no partial pivoting, with AMD | 17,800,600 |
| nnz(V) for QR, upper bound nnz(L) for LU, with COLAMD | 15,387,648 |
| nnz(R) for QR, upper bound nnz(U) for LU, with COLAMD | 34,803,686 |
| SVD-based statistics: | |
| norm(A) | 0.633759 |
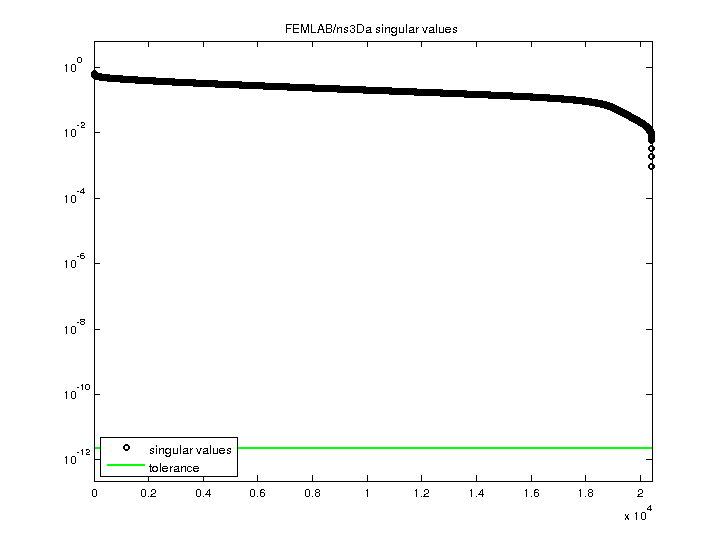
| min(svd(A)) | 0.000896202 |
| cond(A) | 707.161 |
| rank(A) | 20,414 |
| sprank(A)-rank(A) | 0 |
| null space dimension | 0 |
| full numerical rank? | yes |
| singular values (MAT file): | click here |
| SVD method used: | s = svd (full (R)) ; where [~,R,E] = spqr (A) with droptol of zero |
| status: | ok |
For a description of the statistics displayed above, click here.
Maintained by Tim Davis, last updated 12-Mar-2014.
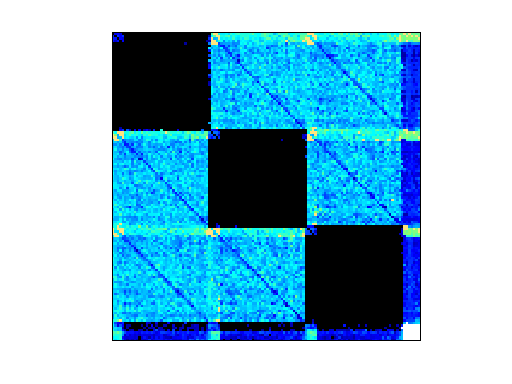
Matrix pictures by cspy, a MATLAB function in the CSparse package.
Matrix graphs by Yifan Hu, AT&T Labs Visualization Group.