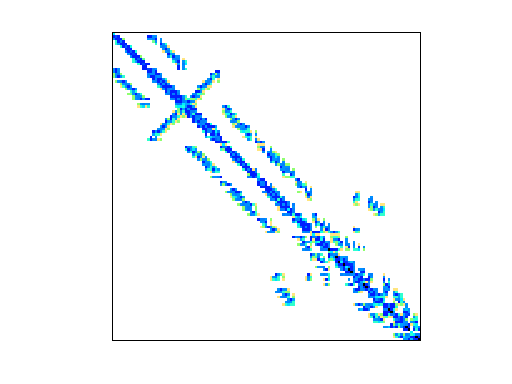
Matrix: Brethour/coater1
Description: Lid-driven cavity, coating flow J. Brethour, CEMS, U. Minn
|
|
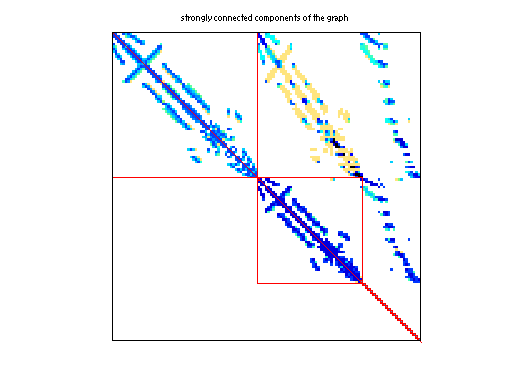
| (bipartite graph drawing) | (graph drawing of A+A') |
 |
 |
 |
| Matrix properties | |
| number of rows | 1,348 |
| number of columns | 1,348 |
| nonzeros | 19,457 |
| structural full rank? | no |
| structural rank | 1,331 |
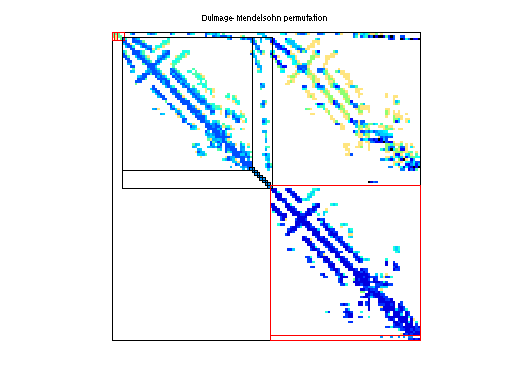
| # of blocks from dmperm | 85 |
| # strongly connected comp. | 262 |
| explicit zero entries | 0 |
| nonzero pattern symmetry | 59% |
| numeric value symmetry | 40% |
| type | real |
| structure | unsymmetric |
| Cholesky candidate? | no |
| positive definite? | no |
| author | J. Brethour |
| editor | T. Davis |
| date | 1997 |
| kind | computational fluid dynamics problem |
| 2D/3D problem? | yes |
| Ordering statistics: | result |
| nnz(chol(P*(A+A'+s*I)*P')) with AMD | 73,686 |
| Cholesky flop count | 6.7e+06 |
| nnz(L+U), no partial pivoting, with AMD | 146,024 |
| nnz(V) for QR, upper bound nnz(L) for LU, with COLAMD | 103,217 |
| nnz(R) for QR, upper bound nnz(U) for LU, with COLAMD | 263,580 |
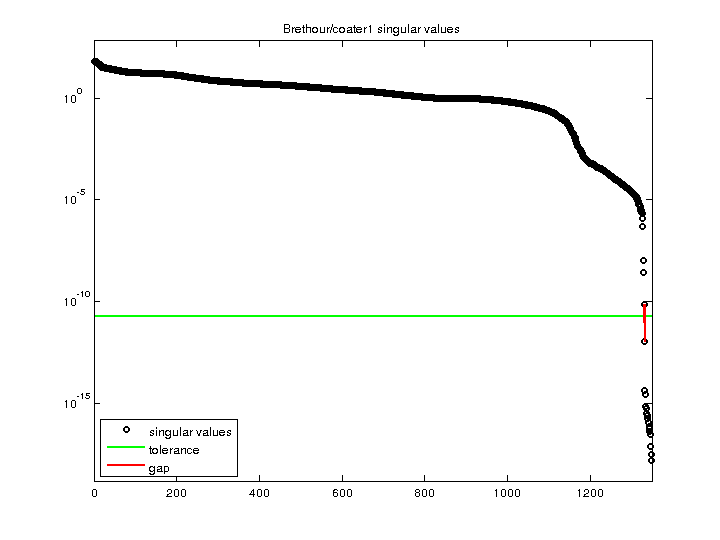
| SVD-based statistics: | |
| norm(A) | 66.5316 |
| min(svd(A)) | 1.44597e-18 |
| cond(A) | 4.60116e+19 |
| rank(A) | 1,330 |
| sprank(A)-rank(A) | 1 |
| null space dimension | 18 |
| full numerical rank? | no |
| singular value gap | 65.1711 |
| singular values (MAT file): | click here |
| SVD method used: | s = svd (full (A)) ; |
| status: | ok |
For a description of the statistics displayed above, click here.
Maintained by Tim Davis, last updated 12-Mar-2014.
Matrix pictures by cspy, a MATLAB function in the CSparse package.
Matrix graphs by Yifan Hu, AT&T Labs Visualization Group.