Provenance Visualization Designs
Provenance visualization provides an overview of analysts’ actions and insights during the exploratory data analysis. Our research studies designs for visually representing the history of data analysis and evaluating the effectiveness of different designs.
Project Lead: Eric Ragan, PhD; Indie Lab at University of Florida
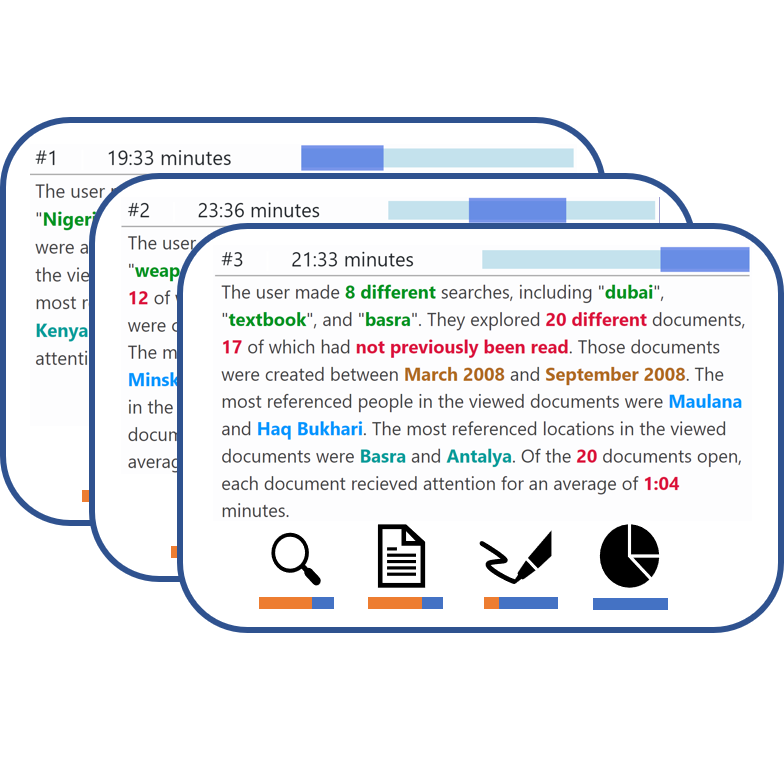
Summary Chunks
The goal for this summarization approach is to mimic simple and familiar reporting structures commonly used in slideshows and text-based reports. Our method converts complex analysis sessions into more easily understandable visual chunks. By processing interaction log data, the approach can break down a long analysis sessions sessions into smaller temporal segments. The method summarizes the associated data interests and interaction activity in each segment, and generates a set of cards with visually-annotated natural language summaries.
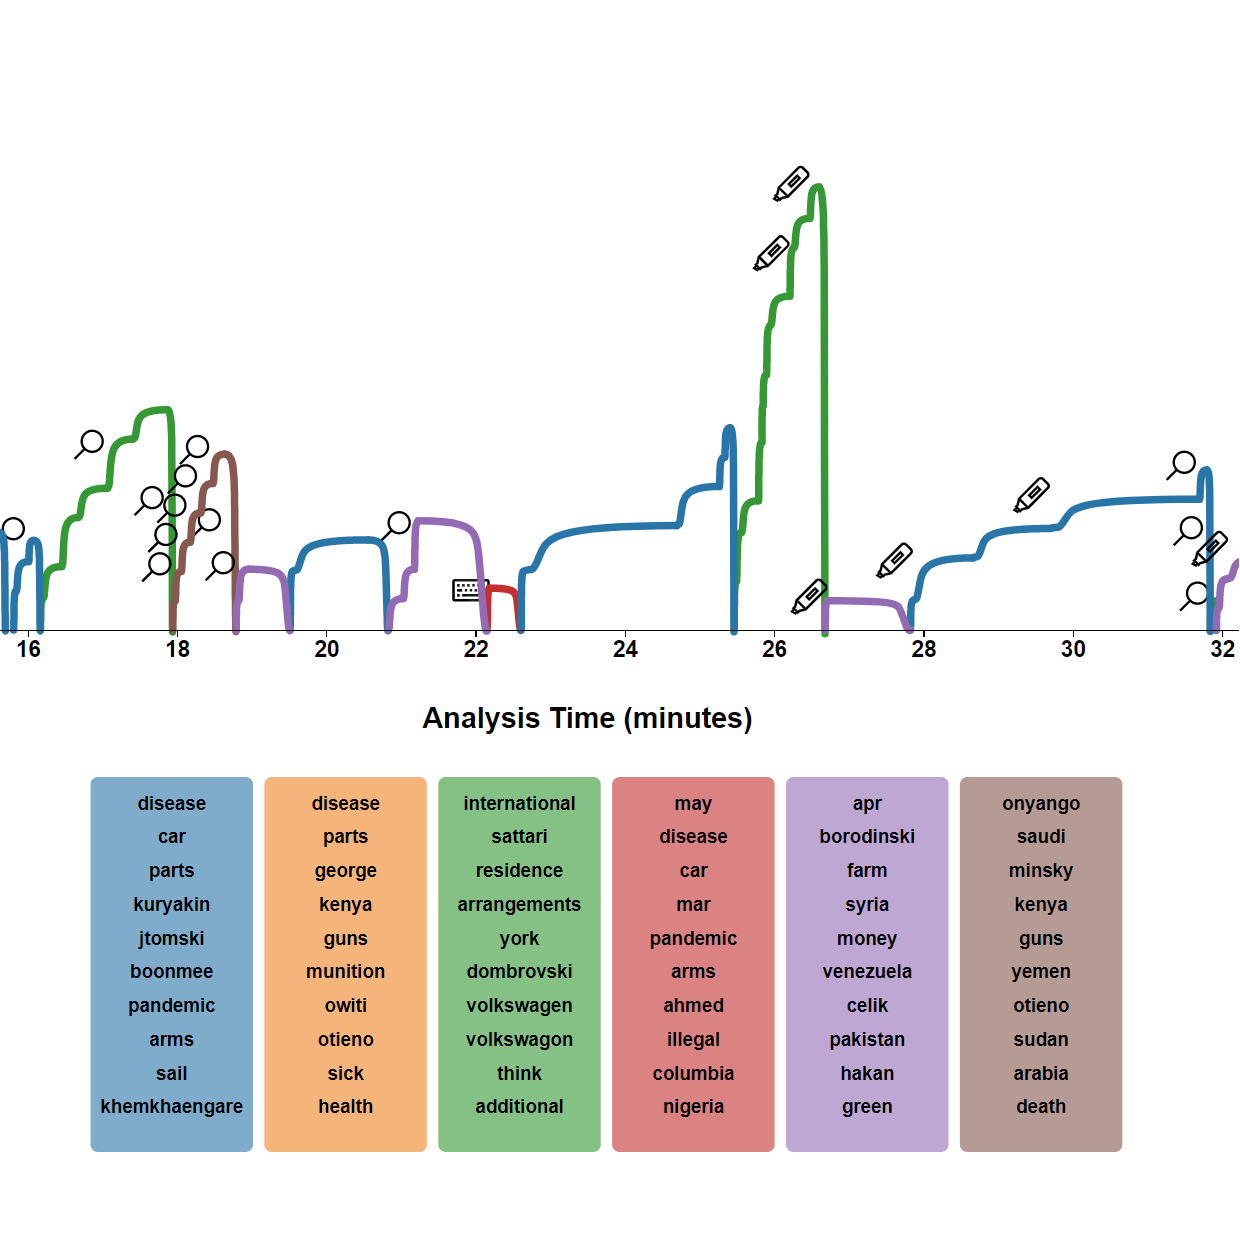
ProvThreads
ProvThreads is a novel visual design that incorporates topic modeling outcomes to illustrate relationships between user interactions and information topics explored in text documents. ProvThreads projects a series of analysis paths to demonstrate both topic coverage and the progression of an investigation over time. This research demonstrates how an analytic process history could be reformed in continuous segments presented by threads of investigations. The method uses interactive topic modeling to help show patterns of user attention to data topics.
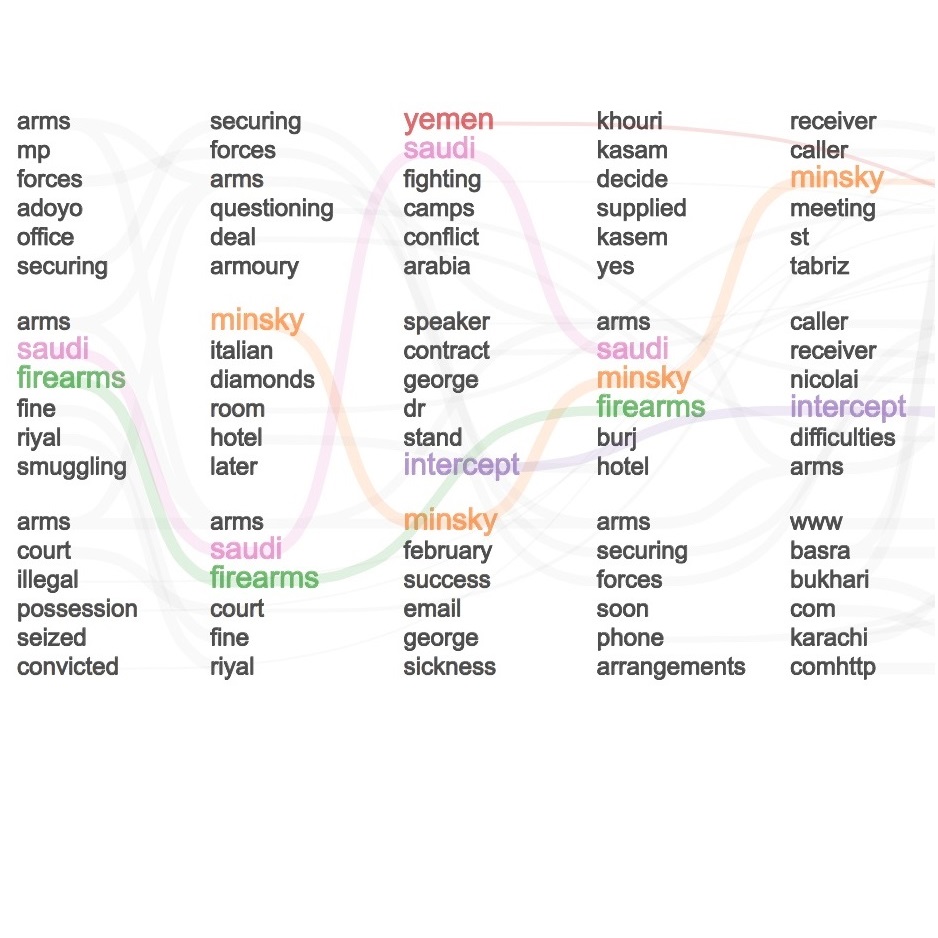
Topic Lists
This approach uses data-interaction events as a proxy for user interest in and experience of information. Logging interactions can detail all available readable content, but full logs may be too verbose to read. Our automated approach uses topic modeling (LDA) on a series of time segments to summarize this verbose information, and finally visualize analyst interest history. This research demonstrates that (1) automatically generated provenance visualizations can be effective for understanding topic trends in analysis and (2) quality of text summaries can vary with time segmentation and interaction type.
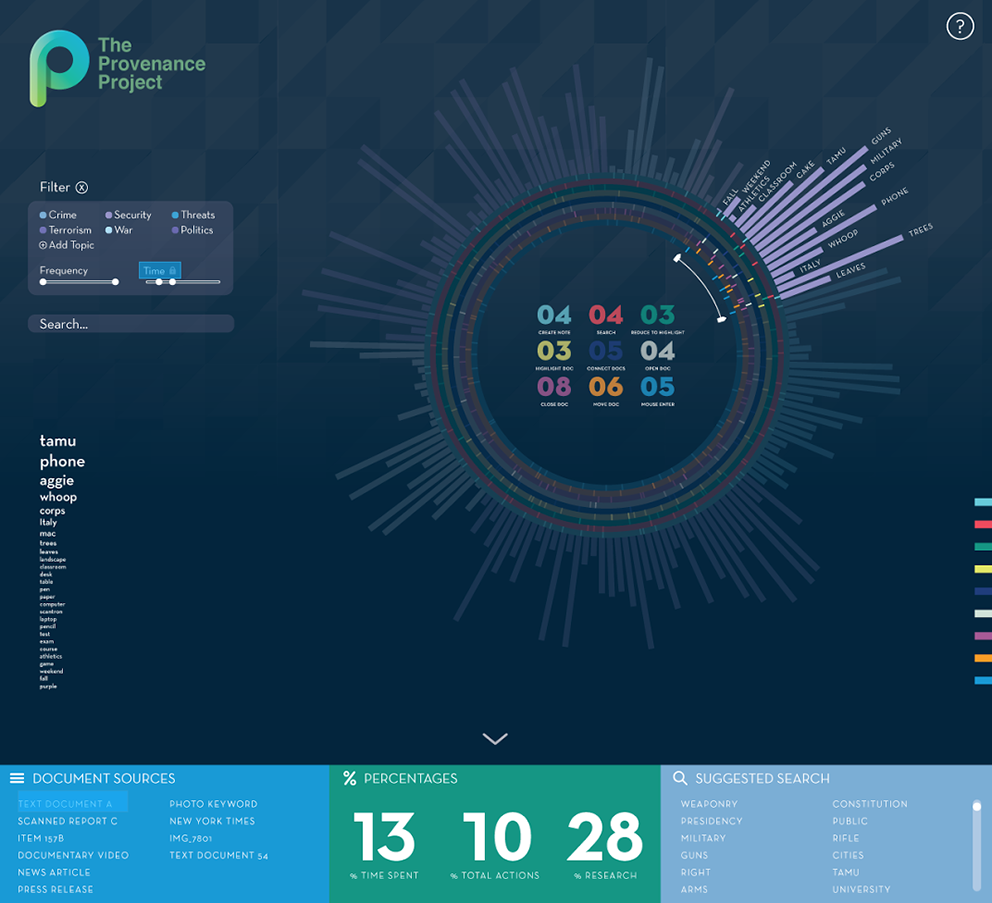
Radial Contrast
As conceptualized design for analyzing provenance of textual analysis, the radial design assist with comparisons of cyclical temporal data or assists in contrasting interaction patterns among different analysts. The design is compatible with filtering through topic modeling and highlighting key terms associated with different stages of the analysis.
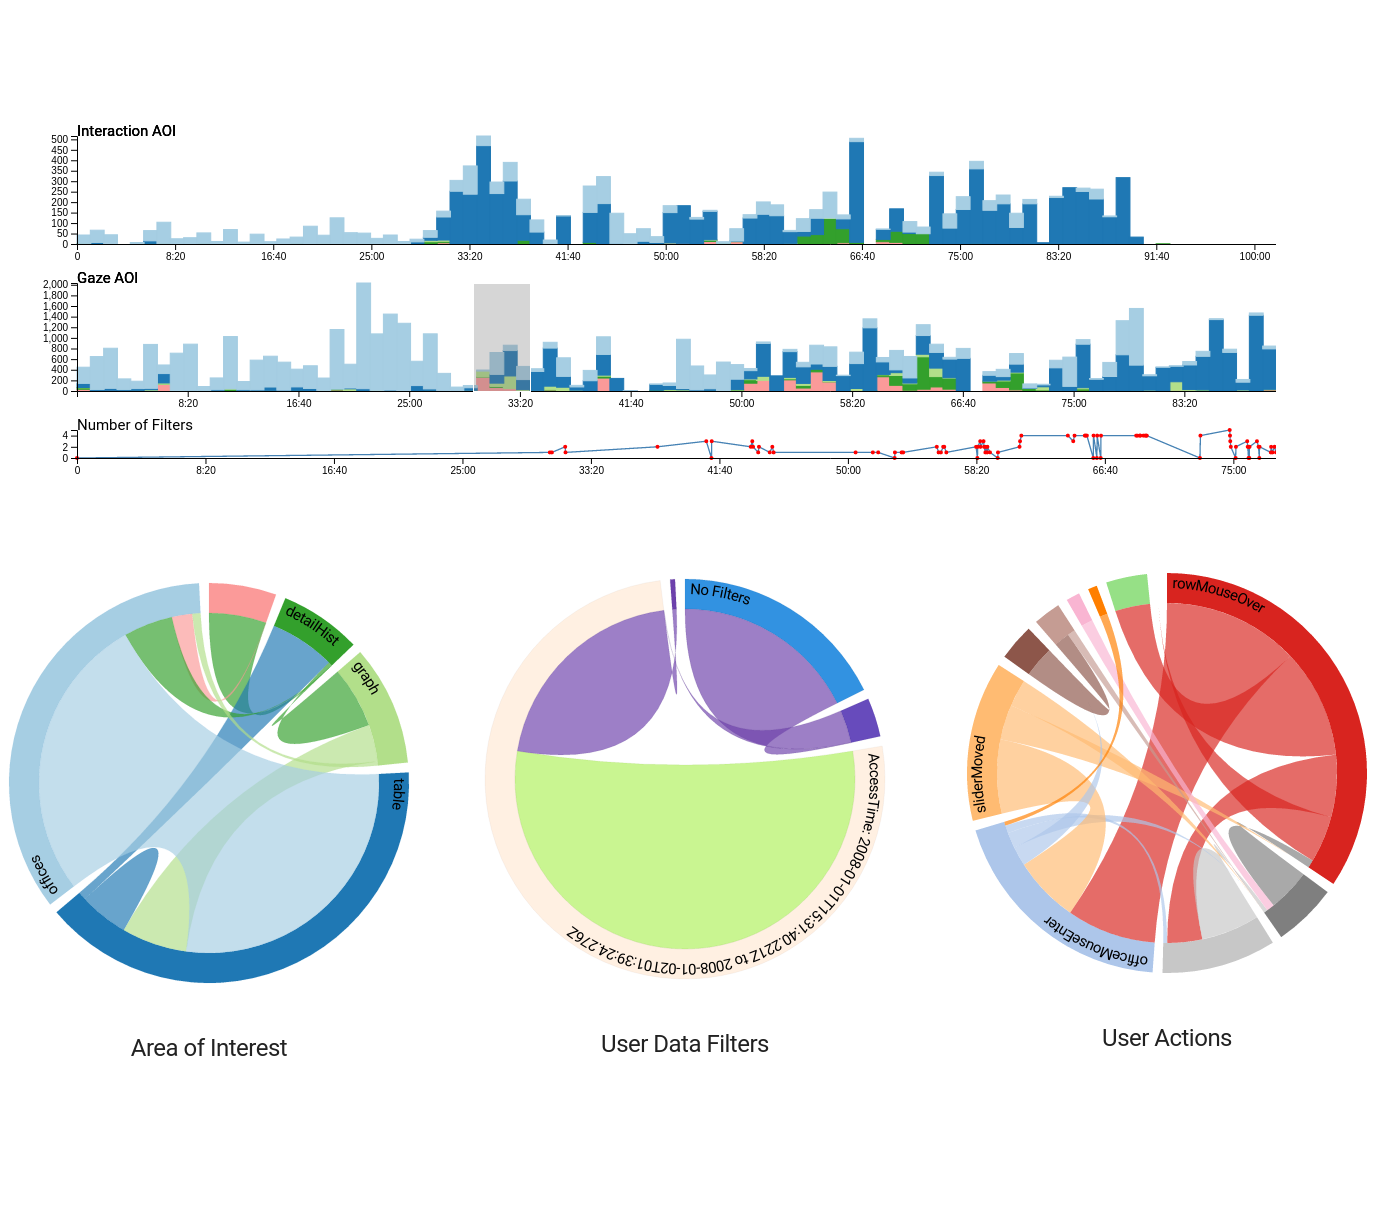
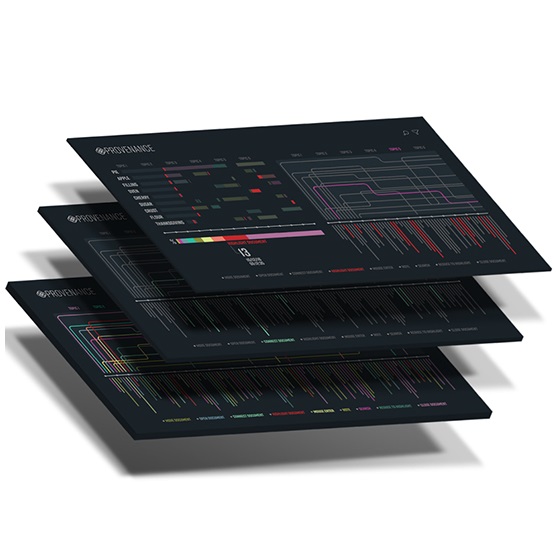
Cyber History Dashboard
A dashboard view for understanding interaction history with dashboard visualizations for data analysis of multidimensional tabular data. This design prioritizes showing attention to different facets of a dashboard interface over time. The history of mouse interactions and eye-tracking patterns allow designers to understand which visualization components are most useful together, and which are rarely used in analysis. Linked views assist exploring overall patterns while a temporal histogram shows changes in inteface attention over time.