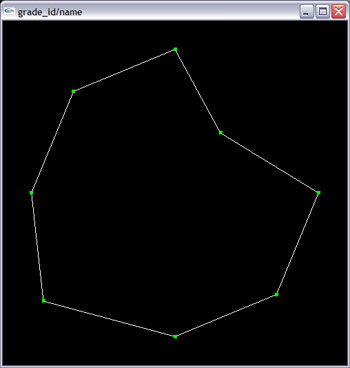
Enable picking and dragging from Project 1a for the \(N=10\) control points \(P_i\) of Project 1b (Tasks 1, 2, and 3) and display the corresponding curve.
The curve should change as the \(P_i\) are moved.
When the keybord shift key is pressed, instead of the movement in the x-y plane, vertical movement of the mouse moves the point along the Z
axis (note: since we look from the top this is not yet visible).
NOTE: Picking should work in Single View, but it is not required in Double View.

In the top half of the window draw the default view perpendicular to the x-y plane. In the bottom half of the window draw the side view perpendicular to y-z plane.
The double-view should be toggled when 4 is pressed.
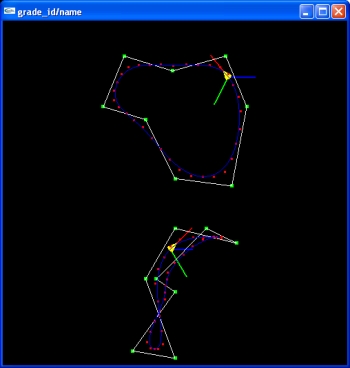
Create a yellow triangle when key 5 is pressed.
It should loop along the curve indefinitely and have an RGB coordinate frame
attached where
R = tangent, G = main normal, B = bi-normal direction.