1. Introduction
Terminology.
Incorporating real objects –participants are able to see, and have virtual objects react to, the virtual representations of real objects
Hybrid environment – a virtual environment that incorporates both real and virtual objects
Object reconstruction – generating a virtual representation of a real object. It is composed of three steps, capturing real object shape, capturing real object appearance, and rendering the virtual representation in the VE.
Real object – a physical object
Dynamic real object – a physical object that can change in appearance and shape
Virtual representation – the system’s representation of a real object
Real-object avatar – same as virtual representation
Volume-querying – given a 3-D point, is it within the visual hull of a real object in the scene?
Collision detection – detecting if the virtual representation of a real object intersects a virtual object.
Collision response – resolving a detected collision
1.1 Driving Issues
Motivation. Conducting design evaluation and assembly feasibility evaluation tasks in immersive virtual environments (VEs) enables designers to evaluate and validate multiple alternative designs more quickly and cheaply than if mock-ups are built and more thoroughly than can be done from drawings. Design review has become one of the major productive applications of VEs [Brooks99]. Virtual models can be used to study the following important design questions:
· Can an artifact readily be assembled?
· Can repairers readily service it?
Ideal Approach. The ideal VE system would have the participant fully believe he was actually performing a task. Every component of the task would be fully replicated. The environment would be visually identical to the real task. Further, the participant would hear accurate sounds, smell identical odors, and when they reached out to touch an object, they would be to feel it. In the assembly verification example, the ideal system would present an experience identical to actually performing the assembly task. Parts and tools would have mass, feel real, and handle appropriately. The user would interact with every object as if he would if he were doing the task. The virtual objects would in turn respond to the user’s action appropriately. Training and simulation would be optimal [Sutherland65]. This is similar to the fictional Holodeck from the futuristic science fiction Star Trek universe, where participants were fully immersed in a computer-generated environment. In the mythos, the environments and objects were so real, if a person were shot with a virtual bullet, he would physically be killed.
Current VE Methods. Obviously, current VEs are far from that ideal system. Indeed, not interacting with every object as if it were real has distinct advantages, as in the bullet example. In current VEs, almost all objects in the environment are virtual. But both assembly and servicing are hands-on tasks, and the principal drawback of virtual models — that there is nothing there to feel, to give manual affordances, and to constrain motions — is a serious one for these applications. Using a six degree-of-freedom (DOF) wand to simulate a wrench, for example, is far from realistic, perhaps too far to be useful. Imagine trying to simulate a task as basic as unscrewing an oil filter from a car engine in such a VE!
Interacting with purely virtual objects imposes two limiting factors on VEs. First, since fully modeling and tracking the participant and other real objects is difficult, virtual objects cannot easily respond to them. Second, since the VE typically has limited information on the shape, appearance, and motion of the user and other real objects, the visual representation of these objects within the VE is usually stylized and not necessarily visually faithful to the object itself.
The user is represented within the virtual environment as an avatar. Avatars are typically represented with stylized virtual human models, such as those provided in commercial packages such as EDS’s Jack [Ward01] or Curious Lab’s Poser 4 [Simone99]. Although these models contain a substantial amount of detail, they usually do not visually match a specific participant’s appearance. Previous research hypothesizes that this misrepresentation of self is so detrimental to VE effectiveness, it will reduce how much a participant believed in the virtual world, his sense-of-presence [Slater93, Welch92, Heeter92].
We extend our definition of an avatar to include a virtual representation of any real object. These real-object avatars are registered with the real object and ideally have the same shape, appearance and motion as the real object.
Getting shape, motion, and actions from real objects, such as the user’s hand, specialized tools, or parts, requires specific development for modeling, tracking, and interaction. For example, in developing our purely virtual condition for our user study, we wanted to allow the users to pick up and manipulate virtual blocks. This required developing code to incorporate tracked pinch gloves, interaction mechanisms among all the virtual objects, and models for the avatar and the blocks. Every possible input, action, and model for all objects, virtual and real, had to be defined, developed, and implemented. The resulting system also enforced very specific ways the user could interact with the blocks. Further, any changes to the VE required substantial modifications to the code or database.
The required additional development effort, coupled with the difficulties of object tracking and modeling, lead designers to use few real objects in most VEs. Further, there are also restrictions on the types of real objects that can be incorporated into a VE. For example, highly deformable objects, such as a bushy plant, would be especially difficult to model and track.
Working with virtual objects could hinder training and performance in tasks that require haptic feedback and natural affordances. For example, training with complex tools would understandably be more effective with using real tools as opposed to virtual approximations.
Incorporating Real Objects. We believe a system that could handle dynamic real objects would assist in interactivity and provide visually faithful virtual representations. We define dynamic objects as real objects that can deform, change topology, and change appearance. Examples include a socket wrench set, clothing, and the human hand. For assembly verification tasks, the user, tools, and parts are typically dynamic in shape, motion, and appearance. For a substantial class of VEs, incorporating dynamic real objects would be potentially beneficial to task performance and presence. Further, interacting with real objects provides improved affordance matching and tactile feedback.
We define incorporating real objects as being able to see and have virtual objects react to the virtual representations of real objects. The challenges are visualizing the real objects within the VE and managing the interactions between the real and the virtual objects.
By having the real objects interacting with a virtual model, designers can see if there is enough space to reach a certain location or train people in assembling a model at different stages, all while using real parts, real tools, and the variability among participants.
Today, neither standard tracking technologies nor modeling techniques are up to doing this in real time at interactive rates.
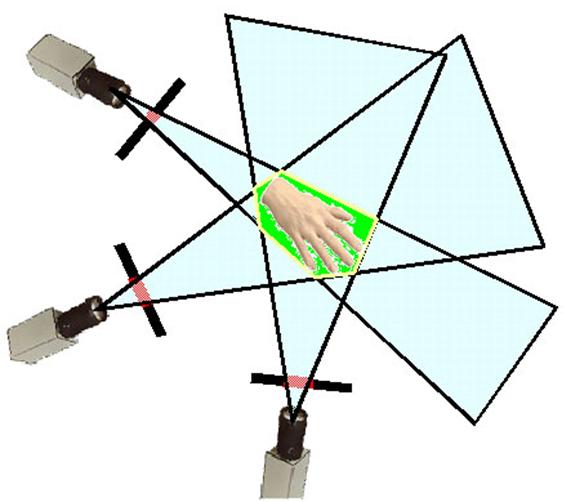
Dynamic Real Objects. Incorporating dynamic real objects requires capturing both the shape and appearance and inserting this information into the VE. We present a system that generate approximate virtual models of dynamic real objects in real time. The shape information is calculated from multiple outside-looking-in cameras. The real-object appearance is captured from a camera that has a similar line of sight as the user.
Video capture of real object appearance has another potential advantage — enhanced visual realism. When users move one of their arms into the field of view, we want to show an accurately lit, pigmented, and clothed arm. Generating virtual representations of the user in real time would allow the system to render a visually faithful avatar.
Slater et al. have shown that VE users develop a stronger sense-of-presence when they see even a highly stylized avatar representing themselves [Slater93, Slater94]. Currently most avatar representations do not visually match each individual user, as the avatar is either a generic model or chosen from a small set of models. Heeter suggests, "Perhaps it would feel even more like being there if you saw your real hand in the virtual world [Heeter92]." Our system enables a test of this hypothesis.
The advantages of visually faithful avatars and interacting with real objects could allow us to apply VEs to tasks that are hampered by using all virtual objects. Specifically, we feel that spatial cognitive manual tasks would benefit with increased task performance and presence from incorporating real objects. These tasks require problem solving through manipulating and orientating objects while maintaining mental relationships among them. These are common skills required in simulation and training VEs.
1.2 Thesis Statement
We started off to prove the following:
Naturally interacting with real objects in immersive
virtual environments improves task performance and sense-of-presence in
cognitive tasks.
Our study results showed a significant task performance improvement, but did not show a significant difference in sense-of-presence.
1.3 Overall approach
Generating Virtual Representations of Real Objects. To demonstrate the truth of this thesis statement, we have developed a hybrid environment system that uses image-based object reconstruction algorithms to generate real-time virtual representations, avatars, of real objects. The participant sees both himself and any real objects introduced into the scene visually incorporated into the VE. Further, the participant handles and feels the real objects while interacting with virtual objects. We use an image-based algorithm that does not require prior modeling, and can handle dynamic objects, which are critical in assembly-design tasks.
Our system uses commodity graphics-card hardware to accelerate computing a virtual approximation, the visual hull, of real objects. Current graphics hardware has a limited set of operations (compared to a general CPU), but can execute those operations very quickly. For example, the nVidia GeForce4 can calculate 3-D transformations and lighting to render 3-D triangles at over 75 million triangles a second. It can also draw over 1.2 billion pixels on the screen per second [Pabst02]. We use these same computations along with the associated common graphics memory buffers, such as the frame buffer and the stencil buffer, to generate virtual representations of real scene objects from arbitrary views in real time. The system discretizes the 3-D visual hull problem into a set of 2-D problems that can be solved by the substantial yet specialized computational power of graphics hardware.
To generate a virtual representation of a real object, we first capture the real object’s shape and appearance. Then we render the virtual representation in the VE. Finally, the virtual representation can collide and affect other virtual objects. We model each object as the visual hull derived from multiple camera views, and we texture-map onto the visual hull the lit appearance of the real object. The resulting virtual representations or avatars are visually combined with virtual objects with correct obscuration.
As the real-object avatars are textured with the image from a HMD-mounted camera with a line of sight essentially the same as the user, participants see a virtual representation of themselves that is accurate in appearance. The results are computed at interactive rates, and thus the avatars also have accurate representations of all joint motions and shape deformations.
Interactions with Virtual Representations of Real Objects. We developed algorithms to use the resulting virtual representations in virtual lighting and in physically based mechanics simulations. This includes new collision-detection and collision-response algorithms that exploit graphics hardware for computing results in real time. The real-object avatars can affect and be affected by simulations of visibility and illumination. For example, they can be lit by virtual lights, shadowed by virtual objects, and cast shadows onto virtual objects. Also, we can detect when the real-object avatars collide with virtual objects, and provide collision responses for virtual objects. This type of interaction allows the real-object avatars to affect simulations such as particle systems, cloth simulations, and rigid-body dynamics.
In our oil filter example, we can thus detect if the real oil filter the user is carrying intersects the virtual engine model, can have the user's hand cast a shadow onto the virtual engine, and can enable the user’s hand to brush a virtual wire aside as he tries to reach a specific area. In a sense we are merging two spaces, a physical space with real objects, and a virtual space with corresponding virtual objects.
User Studies of Real Objects in VEs. Given this system, we wanted to explore the effects of haptics and visual fidelity of avatars on task performance and presence. For cognitive tasks:
- Will task performance significantly improve if participants interact with real objects instead of purely virtual objects?
- Will sense-of-presence significantly improve when participants are represented by visually faithful self-avatars?
As opposed to perceptual motor tasks (e.g., pick up a pen), cognitive tasks require problem-solving decisions on actions (e.g., pick up a red pen). Most design verification and training tasks are cognitive. Studies suggest assembly planning and design are more efficient with immersive VEs, as opposed to when blueprints or even 3-D models on monitors are used [Banerjee99].
To test both hypotheses, we conducted a user study on a block arrangement task. We compared a purely virtual task system and two hybrid task systems that differed in level of visual fidelity. In all three cases, we used a real-space task system as a baseline. For task performance, we compared the time it took for participants to complete the task in the VE condition to their time in performing the task in real space. We wanted to identify how much interacting with real objects enhanced performance.
The results show a statistically significant improvement in task performance measures for interacting with real objects within a VE compared to interacting with virtual objects (Figure 1).
Figure 1 – Task Performance in VEs with different interaction conditions. The Real Space was the baseline condition. The purely virtual had participants manipulating virtual objects. Both the Hybrid and Visually Faithful Hybrid had participants manipulating real objects.
For presence comparison, we used the following explicit definition of presence from Slater and Usoh [Slater93]:
“The extent to which human participants in a virtual environment allow themselves to be convinced while experiencing the effects of a computer-synthesized virtual environment that they are somewhere other than where they physically are – that ‘somewhere’ being determined by the image, sounds, and physical sensations provided by the computer-synthesized virtual environment to their senses.”
We administered a presence questionnaire and interviewed participants after they completed the experience. We compared responses between the VEs that presented generic avatars to the VE that presented a personalized avatar. The results (Figure 2) show an anecdotal, but not statistically significant, increase in the self-reported sense-of-presence for participants in the hybrid environment compared to those in the purely virtual environment.
Figure 2 – Mean Sense-of-presence Scores for the different VE conditions. VFHE had visually faithful avatars, while HE and PVE had generic avatars.
Application to an Assembly Verification Task. We
wanted to apply this system to a real world problem. So we began collaborating with a
payload-engineering group at
The task required the participant to attach a real tube and connect a real power cable to physical connectors while evaluating the surrounding virtual hardware layout. These connectors were registered with a virtual payload model. Collision detection of the user, real tools, and real parts were done against the virtual payload objects.
The participants’ experiences with the system showed anecdotally the effectiveness of handling real objects when interacting with virtual objects. The NASA LaRC engineers were surprised at the layout issues they encountered, even in the simplified example we had created. They mentioned that the correcting errors detected would have saved them a substantial amount of money, time, and personnel costs in correcting and refining their design.
1.4 Innovations
The work described in this dissertation investigates the methods, usefulness, and application of incorporating dynamic real objects into virtual environments. To study this, we developed algorithms for generating virtual representations of real objects at interactive rates. The algorithms use graphics hardware to reconstruct a visual hull of real objects using a novel volume-querying technique.
We also developed hardware-accelerated collision-detection and collision-response algorithms to handle interactions between real and virtual objects. It is to our understanding that this is the first system that allows for incorporation of arbitrary dynamic real objects into a VE.
We wanted to see if these methods for incorporating real objects were advantageous for cognitive tasks. We conducted studies to examine the effects of interaction modality and avatar fidelity on task performance and sense-of-presence. We found that interacting with real objects significantly improves task performance for spatial cognitive tasks. We did not find a significant difference in reported sense-of-presence due to avatar visual fidelity.
We have begun applying our system to a NASA LaRC an assembly verification task. Initial trials with payload designers show promise on the effectiveness of reconstruction systems to aid in payload development.
We expect hybrid VEs to expand the types of tasks and applications that would benefit from immersive VEs by providing a higher fidelity natural interaction that can only be achieved by incorporating real objects.
2. Previous Work
Our work builds on the research areas of and presents new algorithms to incorporating real objects into VEs, human avatars in VEs, and interactions techniques in VEs. We discuss prior research in each area in turn.
2.1 Incorporating Real Objects into VEs
Overview. Our goal is to populate a VE with virtual representations of dynamic real objects. We focus on the specific problem of: given a real object, generating a virtual representation of it. Once we have this representation, we seek to incorporate that into the VE.
We define incorporation of real objects as having VE subsystems, such as lighting, rendering, and physics simulations, be aware of and react to real objects. This involves two primary components, capturing object information and having virtual systems interact with the captured data. We review current algorithms to capturing this information, then look at methods to use the captured data as part of a virtual system.
Applications that incorporate real objects seek to capture the shape, surface appearance, and motion of the real objects. Object material properties and articulation may also be of interest.
The requirements for incorporation of real objects are application-specific. Does it have to be done in real time? Are the objects dynamic, i.e. move, change shape, change appearance, change other properties? What is the required accuracy? How will the rest of the VE use these representations?
Prebuilt, catalog models are usually not available for specific real objects. Making measurements and then using a modeling package is tedious and laborious for complex static objects, and near impossible for capturing the degrees of freedom and articulation of dynamic objects. We give three example applications that require capturing information about specific, complex real objects.
Creating a virtual version of a real scene has many applications in movie making, computer games, and generating 3-D records, e.g., as capturing models of archeological sites, sculptures [Levoy00], or crime scenes. These models can then be viewed in VEs for education, visualization, and exploration. Using traditional tape measure, camera, and CAD approaches for these tasks is extremely time-consuming. These applications benefit greatly from automated highly accurate shape and appearance capture of scenes, usually static ones. Static scenes were among the first real objects for which automated capture has been used.
Techniques to view recorded or live events from novel point of views are enhancing entertainment and analysis applications. They have enabled experts to analyze golf swings and sportscasters to present television viewers dynamic perspective of plays. Kanade’s (CMU) Eye Vision system debuted at Superbowl XXXV and generated novel views of the action from image data generated from a ring of cameras mounted in the stadium [Baba00]. This allowed commentators to replay an event from different perspectives, letting the audience see the action from the quarterback or wide receiver’s perspective. This required capturing within a short amount of time the shape, motion, and appearance information for a large scene populated with many objects.
Tele-immersion applications aim to extend videoconferencing’s 2-D approach to provide 3-D perception. Researchers hypothesize that interpersonal communication will be improved through viewing the other party with all the proper 3-D cues. The Office of the Future project, described by Raskar, generates 3-D models of participants from multiple camera images [Raskar98]. It then transmits the novel view of the virtual representation of the person to a distant location. The communicating parties are highly dynamic real objects with important shape and appearance information that must be captured.
Each of these applications requires generating virtual representations of real objects. We examine current approaches for modeling real objects, tracking real objects, and incorporating the virtual representation of real objects.
Modeling Real Objects. Many commercial packages are available for creating virtual models. Creating virtual models of real objects is a specific subset of the problem called object or scene reconstruction. A common distinction between the two is that object reconstruction focuses primarily on capturing data on a specific set of objects, typically foreground objects, whereas scene reconstruction focuses on capturing data for an entire location.
Applications often have specific requirements for the virtual representation of a real object, and different algorithms are uniquely suited for varying classes of problems. The primary characteristics of model-generation methods for a real object are:
Accuracy – how close to the real object is the virtual representation? Some applications, such as surgery planning, have very strict requirements on how closely the virtual representation needs to correspond to the real object.
Error Type – Is the resulting virtual representation conservative (the virtual volume fully contains the real object) or speculative (there exists points in the real object not within the virtual volume)? What are the systematic and random errors of the system?
Time – Is the approach designed for real-time model generation or is it limited to, and optimized for, models of static objects? For real-time approaches what are the sampling rates and latency?
Active/Passive – Does the capture of object information require instrumenting the real objects, such as attaching trackers, or touching the object with tracked pointers? Some objects such as historical artifacts could be irreversibly damaged by physical interactions. Camera or laser based methods are better approaches to capture delicate objects’ data, as in Levoy’s capture of Michelangelo’s David [Levoy00].
Non Real-Time Modeling of Real Objects. Computing polygonal models of dynamic objects is difficult to do quickly and accurately. Current modeling algorithms have either a high computational requirement or logistical complications for capturing dynamic object shape. The tradeoff between accuracy and computation divides reconstruction algorithms into those suitable for real-time applications and those suitable only for off-line applications. Non-real-time algorithms capture camera images, laser range data, or tracker readings of real objects and hence can emphasize generating accurate geometric models.
One of the first methods for capturing object shape was to track a device, typically a stylus, and move the stylus on the surface of the object and record the reported tracker position. The resulting set of surface points was then typically converted into a polygonal mesh. Commercial products, such as the Immersion Microscribe 3-D, typically use mechanical tracking [http://www.immersion.com/products/3-D/capture/msinfo.shtml].
Commercial products are available that sweep lasers across a surface and measure the time of flight for the beam to reflect to a sensor to capture object shape. Given these distances to points on real objects, algorithms can generate point clouds or polygonal meshes of a real environment [Turk94]. Scene digitizers are useful for modeling real objects or environments, such as a crime-scene or a movie set.
Image-based scene reconstruction is a subcategory of a large class of camera-based model-generation techniques called Shape from X algorithms. Examples of Shape from X include shape from texture, shape from shading, shape from silhouettes, and shape from motion. These techniques generate virtual models of real objects’ shape and appearance through examining changes in input camera images caused by the light interacting with scene objects [Faugeras93a].
The generic problem in Shape from X is to find 3-D coordinates of scene objects from multiple 2-D images. One common approach, correlation-based stereo, is to look for pixels in one image and search for pixels in other images that correspond to the same point on a real object [Faugeras93b]. The multiple sightings of a point establish the point’s position in the scene. The Virtualized Reality work by Kanade et al. uses a dense-stereo algorithm to find correspondences. Forty-nine cameras, connected to seventeen computers, record events in a room [Baba00]. Offline, to generate a view, the nearest five cameras to a virtual camera’s pose are used and baseline stereo is used to generate volumetric representations of real-objects in the scene.
Object reconstruction algorithms generate a volumetric, polygonal, or point cloud representations of objects in the scene. Volumetric approaches to model generation divide space into discrete volume elements called voxels. The algorithms partition or carve the volume into voxels that contain real objects and those that do not based on the established correspondences [Carr98, Chien86, Potmesil87]. Algorithms that calculate real object surfaces output surface points as a point cloud or compute connectivity information to generate polygonal models representations of the real objects [Edelsbrunner92].
Real-Time Modeling of Real Objects. Real-time algorithms simplify the object reconstruction by restricting the inputs, making simplifying assumptions, or accepting output limitations. This allows the desired model to be computed at interactive rates.
For example, the 3-D Tele-Immersion reconstruction algorithm by Daniilidis, et al., restricts the reconstructed volume size so that usable results can be computed in real time using their dense-stereo algorithm [Daniilidis00]. The camera images, numbering five to seven in their current implementation, are reconstructed on the server side and a depth image is sent across the Internet to the client side.
For some applications, precise models of real objects are not necessary. One simplification is to compute approximations of the objects’ shapes, such as the visual hull. A shape-from-silhouette concept, the visual hull, for a set of objects and set of n cameras, is the tightest volume that can be obtained by examining only the object silhouettes, as seen by the cameras [Laurentini94].
At SIGGRAPH 2000, Matusik, et al., presented an image-based visual hull algorithm, “Image Based Visual Hulls” (IBVH), that uses image-based rendering (IBR) algorithms to calculate the visual hull at interactive rates [Matusik00]. First, silhouette boundaries are calculated for all newly introduced real objects through image subtraction. Each pixel in the novel-view image-plane maps to an epipolar line in each source camera image. To determine if the visual hull projects onto a pixel in the novel-view, the source images are examined along these epipolar lines if silhouette spans overlap. Overlaps indicate the visual hull points that project onto the novel-view pixel. Further, the IBVH algorithm computes visibility and coloring by projecting the 3-D point back to the reference images and seeing if there is a clear view to the camera with the nearest view direction to the novel-view direction.
The IBVH system uses four cameras connected to four PCs on a dedicated network to capture images and a quad-processor PC to compute the reconstruction. Their work also provides methods to convert the visual hull surface into polygonal meshes [Matusik01]. Matusik’s algorithm is has an O(n2) work complexity. Our algorithm to recovering real object shape is similar but with substantial differences in both application and functionality.
First, our approach, O(n3), is a graphics hardware-accelerated algorithm that benefits from the rapid performance and functionality upgrades that commodity graphics hardware provides. Second, our visual hull algorithm is well suited for first-person VE rendering with specific algorithms to coloring and multiple viewpoint renderings of the visual hull. Third, our volume-querying algorithm, discussed in detail in Chapter 3 and Chapter 4, provide efficient mechanisms for collision detection and different types of intersection queries with the visual hull. Finally, our algorithm is not sensitive to the number or complexity of the real objects we wish to reconstruct, and the reconstruction and collision detection work complexity scales linearly with the number of cameras.
Registering Virtual Representations with the Real Objects. We enforce a registration of the virtual representation and the real object. For dynamic real objects, this means that we must capture the motion in addition to the shape and appearance. Defining the motion of the real object requires capturing the position and orientation of real objects. To do this, we must consider the following issues:
· Application Requirements – how does the application dictate the performance requirements of the tracking system? For example, head tracking for head-mounted VE systems must return data with minimal latency and high precision. Inability to satisfy these requirements will result in simulator sickness during prolonged exposures. Medical and military training applications have high accuracy and low latency requirements for motion information.
· Real Object Types – identify the types of real objects for which we want to capture motion for. Are the objects rigid bodies, articulated rigid bodies, or fully dynamic bodies? Does the object topology change?
· Available Systems – identify the speed, latency, accuracy, and precision of available tracking systems
Tracking systems, which report the motion of real objects, can be divided into two major groups, active and passive tracking. We define active tracking as physically attaching devices to an object for capturing motion information. In contrast, passive tracking uses outside-looking-in devices, such as lasers or cameras, to capture information without augmenting the objects.
Active tracking is the most common method to track real objects. Devices, that use magnetic fields, acoustic ranging, optical readings, retro-reflectors or gyros, are attached to the object. These devices, either alone, or in combination with an additional sensor source, return location and/or orientation in relation to some reference point. The tracker readings are then used to place and orient virtual models. The goal is to register the virtual model with the real model. For example, Hoffman, et al., attached a magnetic tracker to a real plate to register a virtual model of a plate that was rendered in the VE [Hoffman98]. This allowed the participant to pick up a real plate where the virtual model appeared. Other products include the CyberGlove from Immersion Corporation, which has twenty-two sensors that report joint angles for human hands and fingers [http://www.immersion.com/products/3-D/interaction/cyberglove.shtml], and Measurand’s ShapeTape [Butcher00], a flexible curvature-sensing device that continually reports its form.
This technique has the following advantages:
· Commonly used,
· Well understood,
· Easily implemented,
· Generates very accurate and robust results for rigid bodies
This technique has the following disadvantages:
· Imposes physical restrictions - attaching the tracking devices, mounting locations, and any associated wires could restrict natural object motion.
· Imposes system restrictions – each tracking device typically reports motion information for a single point, usually the devices position and orientation. This limited input is inefficient for objects with substantial motion information, such as a human body.
· Limited applicability for tracking highly deformable bodies. If the object geometry can change or is non-rigid, such as a person’s hair, active tracking is not an effective solution.
As opposed to the augmenting approach of adding trackers, image-based algorithms, such as this work and the previously mentioned Image Based Visual Hulls [Matusik01] and Kanade’s Virtualized Reality [Baba00] use cameras that passively observe the real objects. These algorithms capture object motion through generating new object representations from new camera images.
Camera-based approaches have the following advantages over tracker-based methods for capturing object motion:
· Allow for a greater range of object topologies
· No a priori modeling, hence flexibility and efficiency
· Non-rigid bodies can be more readily handled
· Fewer physical restrictions
Camera-based approaches have the following disadvantages over tracker-based methods for capturing object motion:
· Limited number of views of the scene reduces tracking accuracy and precision
· Limited in dealing with object occlusions and complex object topologies
· Camera resolution, camera calibration, and image noise can drastically effect tracking accuracy
· Difficult to identify any information about the real objects being tracked. Currently the most advanced computer vision techniques are still restricted in the types of real objects they can identify and track in images. The object reconstruction algorithms in particular can only determine whether a volume is or is not occupied, and not necessarily what the object that occupies the volume is. For example, if the user is holding a tool, the system can not disambiguate between the two objects and the volume is treated as one object.
Collision Detection. Detecting and resolving collisions between moving objects is a fundamental issue in physical simulations. If we are to incorporate real objects into the VE, then we must be able to detect when real and virtual objects intersect so as not to create cue conflicts because of interpenetration. From this we can proceed to determine how to resolve the intersection.
Our work not only detects collisions between the VE and the user, but also between the VE and any real objects the user introduces into the system.
Collision detection between virtual objects is an area of vast previous and current research. The applicability of current algorithms depends on virtual object representation, object topology, and application requirements. We review a few image based, graphics-hardware accelerated, and volumetric algorithms to collision detection to which our algorithm is most related.
Our virtual representations of real objects are not geometric models and do not have motion information such as velocity and mass. This imposes unique requirements on detecting and dealing with collisions. Collision detection between polygonal objects, splines, and algebraic surfaces can be done with highly efficient and accurate packages such as Swift++ [Ehmann00]. Hoff and Baciu’s techniques use commodity graphics-hardware’s accelerated functions to solve for collisions and generate penetration information [Hoff01, Baciu99]. Boyles and Fang have proposed algorithms to collision detection between volumetric representations of objects, common in medical applications [Boyles00]. Other work on collision detection between real and virtual objects focused on first creating geometric models of the rigid-body real objects, and then detecting and resolving collision between the models [Breen95].
2.2 Avatars in VEs
Overview. An avatar is an embodiment of an ideal or belief. It is derived from a Sanskrit phrase meaning “he descends” and “he crosses over” referring to a god taking a human form on earth. In VEs, avatars are the participant’s self-representation within the virtual environment. This review focuses on algorithms to generating and controlling the user’s representation, the self-avatar, and on research into the effects of the self-avatar on the immersive VE experience. In the previous section, we used the term avatar to represent the virtual representation of any real object. In this section, we limit our discussion of avatars to the visual representation of the participant.
Current Avatar Approaches. Existing VE systems provide the participant with either choices of an avatar from a library of representations, a generic avatar (each participant has the same avatar), or no avatar at all. From our survey of the VE research, the most common approach is to provide a generic avatar – literally, one size fits all.
Researchers believe that providing generic avatars substantially improves sense-of-presence over providing no avatar [Slater93, Heeter92, Welch96]. In our own experience with the Walking Experiment demo, we have noted some interesting user comments that have led us to hypothesize that a realistic avatar will improve presence over a generic avatar [Usoh99].
Providing accurate avatars requires capturing the participant’s motion and rendering the participant’s form and appearance. Further, we often desire the avatar to be the primary mechanism through which the user interacts with the VE.
The human body has many degrees of freedom of movement. Further, there are large variances in shape and appearance between people. Usoh concludes, “Substantial potential presence gains can be had from tracking all limbs and customizing avatar appearance [Usoh99].” In general, existing VE systems attach extra trackers to the participant for sensing changing positions to drive an articulated stock avatar model. As covered in the other chapters, additional trackers or devices also introduce their own set of restrictions. The degree to which these restrictions may hamper the effectiveness of a VE is application specific and is an important issue for the designer to consider.
Presenting a visually accurate representation of the participant’s shape and pose is difficult due to the human body’s ability to deform. For example, observe the dramatic changes in the shape of your hand and arm as you grasp and open a twist-lid jar. Rigid-body models of the human form lack the required flexibility to capture these intricate shape changes, and developing and controlling models that have the required elasticity is difficult.
Other than shape, appearance is another important characteristic of the human form for avatars. Matching the virtual look to the physical reality is difficult to do dynamically, though commercial systems are becoming available that generate a personalized avatar. With the AvatarMe™ system, participants walk into a booth where four images are taken [Hilton00]. Specific landmarks, such as the top of the head, tip of the hands, and armpits, are automatically located in the images. These points are used to deform stock avatar model geometry and then the images are mapped onto the resulting model. The personalized avatars could then be used in any VE, including interactive games and multi-user online VEs.
We have seen how important having an avatar is, but we will examine a popular VE to help identify common issues in providing good, articulated avatars.
The Walking > Virtual Walking > Flying, in Virtual Environments project, the Walking Experiment, by Usoh, et al., uses additional limb trackers to control the motion of a stock avatar model [Usoh99]. The avatar model in that VE was the same for all participants. It was gender and race neutral (gray in color), and it is wearing a blue shirt, blue pants, and white tennis shoes. We have observed participants comment:
- “Those are not my shoes.”
- “I’m not wearing a blue shirt.”
- (From an African-American teenager) “Hey, I’m not white!”
These comments sparked our investigation to see whether representing participants with a visually faithful avatar would improve the effectiveness of the VE experience.
This Walking Experiment VE has been demoed over two thousand times, yet a version with an articulated tracked avatar (tracking an additional hand or a hand and two feet) has only been shown a handful of times [Usoh99]. The reasons for this include:
· The time required to attach and calibrate the trackers for each person decreased the number of people who could experience the VE.
· The increase in system complexity required more software and hardware for both running and maintaining the VE.
· The increase in encumbrance with the wires and tethers for the trackers made the system more prone to equipment failure.
· The increase in fragility of using more equipment made us weigh the advantages of an increase in realism versus an increased risk of damage to research equipment.
So even with a system capable of providing tracked avatars, the additional hardware might make it infeasible or undesirable to present the more elaborate experience for everyone.
Avatar Research. Current research is trying to understand the effects of avatars on the experience in a VE. Specifically:
· What makes avatars believable?
· Given that we wish the avatar to represent certain properties, what parts of avatars are necessary?
Since creating, modeling, and tracking a complex avatar model is extremely challenging, it is important to determine how much effort and in what directions developers should focus their resources.
Avatars are the source of many different types of information for VE participants, and researchers are trying to identify what components of avatars are required for increased presence, communication, interaction, etc. Non-verbal communication, such as gestures, gaze direction, and pose, provide participants with as much as 60% of information gathered in interpersonal communication. What properties should one choose to have the avatar represent? Thalmann details the current state and research challenges of various avatar components, such as rendering, interaction, and tracking [Thalmann98].
Recent studies suggest that even crude avatar representations convey substantial information. In a study by Mortensen, et al., distributed participants worked together to navigate a maze while carrying a stretcher. The participants were represented with very low quality visual avatars that only conveyed position, orientation, a hand cursor, and speech. The study investigated how participants interacted and collaborated. Even with crude avatar representations, participants were able to negotiate difficult navigational areas and sense the mood of the other participant [Mortensen02].
Slater, et al., have conducted studies on the effects and social ramifications of having avatars in VEs [Slater94, Maringelli01]. They are interested in how participants interact with virtual avatars and the similarities (and the important components to invoke these responses) with real human interaction. One early study compared small group behavior under three conditions: fully immersive VE, desktop (computer screen), and real environments. In both the immersive VE and desktop conditions, participants navigated and interacted with other participants in a VE while being represented by crude avatars. With avatars, emotions such as embarrassment, irritation, and self-awareness could be generated in virtual meetings. Their research studies showed that having some representation of the participants in the environment was important for social interaction, task performance, and presence.
In Garau’s study, they compared participant interaction when communicating with another person represented by: audio only, avatars with random gaze, avatars with inferred (tracked user eye motion) gaze, and high-quality audio/video. The results show a significant difference between conditions, with the inferred-gaze condition consistently and significantly outperforming the random-gaze condition in terms of participants’ subjective responses [Garau01].
They are also exploring using avatars in working with public speaking phobias [Pertaub01] and distributed-users task interaction [Slater00, Mortensen02]. Their work points to the strong effect on sense-of-presence and VE interactivity of even relatively crude self-avatars.
2.3 Interactions in VEs
Overview. Interacting with the virtual environment involves providing inputs to, or externally setting variables in, a world model simulation. Some inputs are active, such as scaling an object or using a menu, and others are passive, such as casting a shadow in the environment or making an avatar’s hand collide with a virtual ball.
Active inputs to the VE are traditionally accomplished by translating hardware actions, such as button pushes or glove gestures, to actions such as grasping [Zachmann01]. For example, to select an object, a participant typically moves his avatar hand or selection icon to intersect the object, and then presses a trigger or makes a grasping or pinching gesture.
Passive inputs depend on incorporating real-object avatars as additional data objects in simulation systems running within the environment, such as rigid-body simulations, lighting and shadow rendering, and collision detection algorithms. Typically, these passive interactions cause the world to behave as expected as the participant interacts with the environment in the way he is used to.
VE Interaction Research. Human computer interaction researchers have studied taxonomies of the active inputs to VEs. Doug Bowman’s dissertation and Hand’s survey on interaction techniques (ITs) decompose actions into basic components, such as selection and translation [Hand97, Bowman97]. Some tasks, such as deleting or scaling an object, are inherently active as they do not have a real world equivalent.
Ideally, a participant should be able to interact with the virtual environment by natural speech and natural body motions. Human limbs are articulated with many segments; their surfaces are deformable. Ideally, the VE system would understand and react to expressions, gestures, and motion. How do we capture all this information, both for rendering images and for input to simulations? This is the tracking problem, and it is the least developed area of VE technology.
The fundamental problem is that most things are not real in a virtual environment. Of course, the other end of the spectrum – having all real objects – removes any advantages of using a VE such as quick prototyping, or training and simulation for expensive or dangerous tasks. The optimal combination of real and virtual objects depends on the application. Examples of a near perfect combination of real and virtual objects are flight simulators. In most state-of-the-art flight simulators, the entire cockpit is real, with a motion platform to provide motion sensations, and the visuals of the environment outside the cockpit are virtual. The resulting synergy is so compelling and effective it is almost universally used to train pilots.
Having everything virtual removes many of the important cues that we use to perform tasks, such as motion constraints, tactile response, and force feedback. Typically these cues are either approximated or not provided at all. Depending on the task, this could reduce the effectiveness of a VE.
There has been previous work on the effect of interacting with real objects on VE graphical user interfaces (GUIs). Lindeman, et al., conducted a study that compared 2-D and 3-D GUI widgets and the presence of a physical interaction surface. The tasks were a slider task (match a number by sliding a pip) and a drag-and-drop task. The virtual GUI had different types of surfaces with which it was registered: a tracked real surface, a virtual surface, and a virtual surface that visually clamped the avatar when the avatar intersected with it. The difference in performance for two tasks between using the 2-D and 3-D widgets were mixed. The physical surface was significantly better than the clamped virtual surface, which was in turn significantly better than a purely virtual surface [Lindeman99].
Current Interaction Methods. Specialized devices are tracked and used to provide participant inputs and controls for the VE. Common commercial interaction devices include a tracked articulated glove that with gesture recognition or buttons (Immersion’s Cyberglove [http://www.immersion.com/products/3-D/interaction/cyberglove.shtml]), tracked mouse (Ascension Technology’s 6D Mouse [http://www.ascension-tech.com/products/6dmouse/]), or tracked joystick with multiple buttons (Fakespace’s NeoWand [http://www.fakespacesystems.com/pdfs/FS_ss_NeoWand.pdf]). Interactions comprise of motions and/or button presses.
If those devices do not provide the needed interaction,
often a device is specially engineered for the specific task. This could improve interaction affordances,
as the participant interacts with the system in a more natural manner.
3. Real Object Reconstruction
This algorithm was presented at the 2001 ACM Symposium on Interactive 3-D Graphics [Lok01].
Terminology.
Incorporating real objects – participants are able to see, and have virtual objects react to, the virtual representations of real objects
Hybrid environment – a virtual environment that incorporates both real and virtual objects
Participant – a human immersed in a virtual environment
Real object – a physical object
Dynamic real object – a physical object that can change in appearance and shape
Object reconstruction – generating a virtual representation of a real object. It is composed of three steps, capturing real object shape, capturing real object appearance, and rendering the virtual representation in the VE.
Real-object avatar – virtual representation of a real object
Image segmentation – the process labeling each pixel in an image as corresponding to either foreground objects (objects to be reconstructed) or background objects
Object pixel – a pixel that correspond to foreground objects
Background pixel – a pixel that correspond to background objects
Background image – stored image of a vacated scene that is captured during startup.
Segmentation threshold – the minimum color difference between a new image and its background image for a pixel to be labeled an object pixel.
Segmentation threshold map – an array of segmentation threshold values for all the pixels of a camera image
Object-pixel map – an array of the pixel segmentation results for an image.
Novel viewpoint – a viewpoint and view-direction for viewing the foreground objects. Typically, this novel viewpoint is arbitrary, and not the same as that of any of the cameras. Usually, the novel viewpoint is the participant’s viewpoint.
Visual hull – virtual shape approximation of a real object
This work presents new algorithms for object reconstruction, capturing real-object shape and appearance, and then incorporating these real-object avatars with other virtual objects. In this chapter, we present an algorithm for real-time object reconstruction.
3.1 Introduction
Goal. Incorporating a real object into a hybrid environment should allow the participant to hold, move and use the real object while seeing a registered virtual representation of the real object in the virtual scene.
We have two choices for generating virtual representations of the real objects: either model the real objects off-line and then track and render them on-line, or capture and render real object shape and appearance on-line. Our approach is the latter. This requires computing new virtual representations of real objects at interactive rates.
Algorithm Overview. We present a new, real-time
algorithm for computing the visual hull of real objects that exploits the
tremendous recent advances in graphics hardware. Along with the Image-Based Visual Hulls work
[Matusik00] cited earlier, this algorithm is one of the first for real-time
object reconstruction. This algorithm
requires no tracking of the real objects, and can also be used for collision
detection, as is discussed in Chapter 4.
The first step in incorporating a real object into a VE is to capture real objects’ shape and appearance to generate the virtual representation. We have chosen to approximate the shape of the real objects in the scene with a visual hull. The visual hull technique is a shape-from-silhouette approach. That is, it examines only the silhouettes of the real objects, viewed from different locations, to make a surface approximation. The projection of a silhouette image carves space into a volume that includes the real objects, and a remaining volume that does not. The intersection of the projections of silhouette images approximates the object shape. The visual hull is a conservative approach that always fully circumscribes the real objects. If a 3-D point is within the real object, it is within that object’s visual hull.
Depending on the object geometry, silhouettes information alone will not define an accurate surface. Concavities, such as the insides of a cup, cannot be approximated with silhouettes, even from an infinite number of external views. Since the visual hull technique uses only silhouettes, the object’s color information, which might help in determining convexity, correlations, and shadows, is not used in computing real object shape.
3.2 Capturing Real Object Shape
The reconstruction algorithm, takes as input multiple, live, fixed-position video camera images, identifies newly introduced real objects in the scene (image segmentation) and then computes a novel view of the real objects’ shape (volume-querying).
Image Segmentation Algorithm. We assume that the scene will be made up of static background objects and foreground objects that we wish to reconstruct. The goal of this stage is to identify the foreground objects in the camera images of the scene. To do this we employ the well-known image segmentation technique of image subtraction with thresholds, for extracting the objects of interest [XXX]. Each camera’s view of the static background scene is captured as a background image. We label pixels that correspond to foreground objects as object pixels, and pixels that represent the static background, background pixels. Image segmentation generates an object-pixel map that segments the camera images into object pixels and background pixels. Simplistically,
Equation 1 – High-level expression for image segmentation
(static background scene + foreground objects) – (static background scene) = foreground objects.
But, the input camera images contain noise – corresponding pixels in multiple images of a static scene actually vary slightly in color. This is due to both mechanical noise (the camera is not perfectly still) and electrical noise. Not taking this image color variability into account would result in many pixels being identified wrongly as a part of a foreground object. One approach for managing this color variation is to use segmentation threshold. In each new camera image, each pixel whose color difference from its corresponding background image pixel is greater than its corresponding threshold pixel is labeled as an object pixel. That is, the object-pixel map value for that pixel is set to 1. For background pixels, the object-pixel map value is set to 0. This gives us the modified equation:
Equation 2 - Image Segementation
Li – Source camera image for camera i (x x y resolution) [pixels]
Oi – Object-pixel map for camera i (x x y resolution) [pixels]
Bi – Background image for camera i (x x y resolution) [pixels]
Ti – Segmentation threshold map for camera i (x x y resolution) [pixels]

As the noise in a static scene can vary across an image, we set segmentation threshold values on a per-pixel basis. The segmentation threshold map is an array of statistically-based threshold values (see implementation section) that characterizes the noise of the background image for a camera. Background image pixels that correspond to edges or areas with high spatial frequency will have higher variation because of camera vibration. Too high a threshold value results in missed object pixels, and so we tried to minimize high spatial frequency portions in the background images by draping dark cloth over most surfaces.
Image segmentation returns results that are sensitive to shadows, changes in lighting, and image noise. For example, altering the lighting without capturing new background images would increase errors in image segmentation. We attempted to keep the lighting constant. We did not attempt to identify or filter out real object shadows, but we used diffuse lighting so shadows would not be sharp.
Image Segmentation Implementation. At initialization, five frames of the background scene are captured for each camera. These images are averaged to compute a background image. To compute a camera’s segmentation threshold map, we took the maximum deviation from the average as a segmentation threshold value on a per-pixel basis. We found that five images of the static background were sufficient to calculate useful background images and segmentation threshold maps.
Figure 3 - Frames from the different stages in image segmentation. The difference between the current image (left) and the background image (center) is compared against a threshol to identify object pixels. The object pixels are actually stored in the alpha channel, but for the image (right), we cleared the color component of background pixels to help visualize the object pixels.
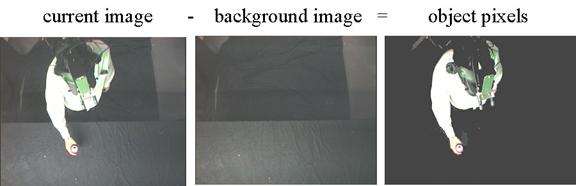
Image segmentation with thresholds is essentially the same as Chromakeying, a standard technique for separating foreground objects from a monochromatic background, used in television and movies.
The image segmentation stage augments the current camera image with the object-pixel map encoded into the alpha channel. Object pixels have an alpha of 1 (full opacity), and background pixels have an alpha of 0 (full transparency).
Volume-querying Algorithm. Given the object-pixel maps from image segmentation, we want to view the visual hull [Laurentini94] of the real objects. In general we want to see the visual hull from a viewpoint different from that of any of the cameras. To do this, we use a method we call volume-querying, a variation on standard techniques for volume definition given boundary representations [Kutulakos00].
Volume-querying asks, Given a 3-D point (P), is it within the visual hull (VH) of a real object in the scene? P is within the visual hull iff for each camera i (with projection matrix Cm), P projects onto an object pixel (Li, j s.t. Oi,j = 1 (camera i, object pixel j).
~VHobject – (calculated) Visual hull of the real object
P – a 3-D point (3 x 1 vector) [meters]
Ci – Camera i defined by its extrinsic {Ct translation (3 x 1 vector) and Cr rotation (3 x 3 matrix)} and intrinsic {Cd radial distortion (scalar), Cpp principal point (2 x 1 vector), Cf focal lengths (2 x 1 vector)} parameters, and Cs resolution (x x y). Cm is the projection (4 x 4 vector) matrix given the camera’s extrinsic and intrinsic parameters.
Equation 3 – Volume-querying
P ' ~VHobject iff " i, ' j such that Oi , j = Cm, i *P, Oi , j = 1
For rendering the visual hull from a novel viewpoint, we volume-query a sampling of the view frustum volume. This is in effect asking, which points in the novel view volume are within the visual hull?
Recall that object pixels represent the projection of a real object onto a camera’s image plane. The visual hull is the intersection of the 3-D projected right cones (a cone with its major axis perpendicular to its base) of the 2-D object-pixel maps as shown in Figure 4.
Figure 4 – The visual hull of an object is the intersection of the object pixel projection cones of the object.
Computing the intersection requires testing each object pixel’s projected volume from a camera against the projected volumes of object pixels from all the other cameras. Given n cameras with u x v resolution, the work complexity would be (u*v)2 * (n-1). The reconstruction volume is the intersection of all the cameras’ frusta, and it is the only part of the volume that could detect object pixel intersections.
For example, with 3 NTSC cameras, there could be up to (720*486)2 * 2 = 2.45 * 1011 pyramid-pyramid intersection tests per frame. The number of intersection tests grows linearly with the number of cameras and with the square of the resolution of the cameras.
Accelerating Volume-querying with Graphics Hardware. We use the graphics-hardware-accelerated functions of projected textures, alpha testing, and stencil testing in conjunction with the depth buffer, stencil buffer, and frame buffer for performing intersection tests. We want to generate a view of the visual hull from the same viewpoint, view direction, and field of view as the virtual environment is rendered from. For a u x v resolution viewport into which the visual hull is rendered, we use the following graphics hardware components, which are standard on commodity graphics chipsets such as the nVidia GeForce4, SGI Infinite Reality 3, and ATI Radeon:
- frame buffer – u x v array of color values of the first-visible surface of the visual hull. Each element in the frame buffer has four values: red, green, blue, and alpha.
- depth buffer – u x v array of depth values from the eye viewpoint to the first-visible surface of the visual hull.
- stencil buffer – u x v array of integer values. The stencil buffer is used to store auxiliary values and has basic arithmetic operations such as increment, decrement and clear. The stencil buffer is used to count object pixel projection intersections during volume-querying.
- projected textures – generates texture coordinates for a primitive by multiplying the vertex position by the texture matrix.
- alpha testing – determines whether to render a textured pixel based on a comparison against a reference alpha value.
- stencil testing – determines whether to render a pixel based on a comparison of the pixel’s stencil value against a reference stencil value.
Using the results of image segmentation, each camera’s image, with the corresponding object-pixel map in the alpha channel, is loaded into a texture. The camera image color values are not used in generating object shape. Chapter 3.3 discusses how the image color values are used for deriving object appearance.
Volume-querying a point. First we discuss using the graphics hardware to implement volume-querying for a single point, and then we extend the explanation to larger primitives. For any given novel view V (with perspective matrix MV) and n cameras, we want to determine if a 3-D point P is in the visual hull. For notation, P projects onto pixel p in the desired novel view image plane. Equation 3 states that for P to be within the visual hull, it must project onto an object pixel in each camera. This translates to when rendering P with projected camera textures, P must be textured with an object pixel from each camera.
Rendering a textured point P involves
· Transforming the 3-D point P into 2-D screen space p
· Indexing into the 2-D texture for the texel that projects onto the P
· Writing to the frame buffer the texel color
To perform this operation, P is rendered n times. When rendering P for the ith time, camera i’s texture is
used, and the texture matrix is set to the camera i’s projection matrix
(Ci). This generates
texture coordinates for P that are a perspective projection of image
coordinates from the camera’s location.
To apply a texel only if it is an object pixel, an alpha test to render
texels only with alpha = 1 is enabled.
The stencil buffer value for p is used to count the number of cameras whose object pixels texture P. The stencil buffer value is initialized to 0. Since only texels with an alpha of 1 can texture a point, if P is textured by camera i, it means P projected onto an object pixel in camera i (P = Cm, i-1Oi), and we increment p’s stencil buffer by 1.
Once all n textures are projected, p’s stencil buffer will contain values in the range [0, n]. We want to keep p as part of the virtual representation, i.e., within the visual hull, only if its stencil value is equal to n. To do this we change the stencil test to clear p’s stencil buffer and frame buffer values if p’s stencil value < n.
Since P is rendered from the novel view, p’s depth buffer value holds the distance of P from the novel viewpoint. The frame buffer holds the color value, which is an automatic result of the foregoing operation. We discuss different approaches to coloring later.
Volume-Querying a 2-D Primitive. We now extend the volume-querying to 2-D primitives, such as a plane. To render the visual hull from a novel viewpoint, we want to volume query all points within the volume of the view frustum. As this volume is continuous, we sample the volume with a set of planes perpendicular to the view direction, and completely filling the reconstruction viewport. Instead of volume-querying one point at a time, the volume-querying is done on the entire plane primitive. The set of planes are volume-queried from front to back. This choice of planes is similar to other plane sweep techniques [Seitz97].
To perform volume-querying on a plane using graphics hardware, the plane is rendered n+1 times, once with each camera’s object-pixel map projected, and once to keep only pixels with a stencil buffer value = n. Pixels with a stencil value of n correspond to points on the plane that are within the visual hull. The set of planes are rendered from front to back. The frame buffer and stencil buffer are not cleared between planes. The resulting depth buffer is the volume-sampled first visible surface of the visual hull from the novel viewpoint. This is how the algorithm generates the virtual representation’s shape.
Equation 4 – Plane sweeping
PS – Spacing between planes for plane sweep volume-querying [meters]
U – User’s pose (Tracker report for position and orientation, field of view, near plane, far plane)
S – Novel view screen resolution (u x v) [pixels]
f(U,S,k) – generates a plane that fully takes up the viewport a distance k from the user’s viewpoint
![]()
The number and spacing of the planes are user-defined. Given the resolution and location of the input cameras, we sample the volume with 1.5 centimeter spacing between planes throughout the participant’s view frustum. By only volume-querying points within the view frustum, we only test elements that could contribute to the final image.
In implementation, the camera images contain non-linear distortions that the linear projected-texture hardware cannot process. Not taking into account these intrinsic camera parameters, such as radial distortion, focal length, and principal point, will result in an object pixel’s projection not sweeping out the same volume in virtual space as in real space. Instead of using the projected texture hardware, the system computes undistorted texture coordinates. Each plane is subdivided into a regular grid, and the texture coordinates at the grid points are undistorted through pushing the image coordinates through the intrinsic camera model discussed in [Bouguet98]. Although the texture is still linearly interpolated between grid points, we have observed that dividing the plane into a 5 x 5 grid and undistorting the texture coordinates at the grid points reduces error in visual hull shape. Reconstruction performance is not hampered, because the algorithm performance is not transformation-bound.
Equation 5 – Camera Model
P – a 3-D point (3 x 1 vector) [meters]
p – 2-D projection of P (2 x 1 vector)
Ci – Camera i defined by its extrinsic {Ct translation (3 x 1 vector) and Cr rotation (3 x 3 matrix)} and intrinsic {Cd radial distortion (scalar), Cpp principal point (2 x 1 vector), Cf focal lengths (2 x 1 vector)} parameters, and Cs resolution (x x y). Cm is the projection (4 x 4 vector) matrix given the camera’s extrinsic and intrinsic parameters.

OpenGL Psuedocode.
//Enable
the alpha test so we only texture object pixels
glEnable(
GL_ALPHA_TEST );
glAlphaFunc(
GL_GREATER, 0.0 );
//Turn
on the stencil test
glEnable(
GL_STENCIL_TEST );
//Since
the stencil buffer keeps relevant pixels, it performs z-testing
glDepthFunc(
GL_ALWAYS );
//Enable
texturing
glEnable(
GL_TEXTURE_2-D );
//Sweep
planes from near to far
for
( fPlane = fNear; fPlane < fFar; fPlane += fStep )
{
//Stencil operations are set to increment if
the pixel is
//textured
glStencilOp( GL_KEEP, GL_KEEP, GL_INCR );
//For all cameras we draw a projected texture
plane
for each camera i
{
//The test function is updated to
draw only if a stencil
//value
equals the number of cameras already drawn
glStencilFunc( GL_EQUAL, i, ~0 );
//Bind the camera i’s current texture
glBindTexture( GL_TEXTURE_2-D, camera i’s
texture );
//Draw the plane
DrawPlane();
}
//We want to keep only pixels with a
stencil value equal
//to iNumCameras
glStencilFunc( GL_GREATER, iNumCameras,
~0 );
//Zero everything else
glStencilOp( GL_KEEP, GL_ZERO, GL_ZERO );
glBindTexture( GL_TEXTURE_2-D, WHITE );
DrawPlane();
}
3.3 Capturing Real Object Appearance
Volume-querying only captures the real object shape. Since we were generating views of the real objects from the participant’s perspective, we wanted to capture the real object’s appearance from the participant’s point of view. A lipstick camera with a mirror attachment was mounted onto the HMD, as seen in Figure 8. Because of the geometry of the fixture, this camera had a virtual viewpoint and view direction that is essentially the same as the participant’s viewpoint and view direction. We used the image from this camera for texturing the visual hull. This particular camera choice finesses a set of difficult problems of computing the correct pixel color for the visual hull, which involves accounting for visibility and lighting.
If rendering other than from the participant’s point of view is required, then data from the camera images are used to color the visual hull. Since our algorithm does not build a traditional model, computing color and visibility per pixel is expensive and not easily handled.
We implemented two approaches to coloring the first visible surface of the visual hull. The first approach blended the camera textures during plane sweeping. While rendering the planes each texture was given a blend weighting, based on the angle between each camera’s view direction and the normal of the plane. The results have some distinct texturing artifacts, such as incorrect coloring, textures being replicated on several planes, and noticeable texture borders. This was due to not computing visibility, visual hull sampling, and the differences in shape between the real object and the visual hull.
The second approach generated a coarse mesh of the reconstruction depth buffer. We assume the camera that most likely contributed to a point’s color is that with a view direction closest to the mesh’s normal. For each mesh point, its normal is compared to the viewing directions of the cameras. Each vertex gets its color from the camera whose viewing direction most closely matches its normal. The process was slow and the result still contained artifacts.
Neither of our two approaches returns a satisfactory non-user viewpoint coloring solution. The Image Based Visual Hulls algorithm by Matusik computes both the model and visibility and is a better suited for reconstruction from viewpoints other than the participant’s [Matusik00, 01].
3.4 Combining with Virtual Object Rendering
During the plane-sweeping step, the planes are rendered and volume-queried in the same coordinate system as the one used to render the virtual environment. Therefore the resulting depth buffer values are correct for the novel viewpoint. Rendering the virtual objects into the same frame buffer and depth buffer correctly resolves occlusions between real objects and virtual objects based on depth from the eye. The real-object avatars are visually composited with the virtual environment.
Combining the real-object avatars with the virtual environment must include the interplay of lighting and shading. For real-object avatars to be lit by virtual lights, a polygon mesh of the reconstruction depth buffer values is generated. The mesh is then rendered with the OpenGL lighting. The lit vertices are then modulated with the HMD camera texture through using OpenGL blending. We can also use standard shadowing algorithms to allow virtual objects to cast shadows on the real-object avatars.
Shadows of real-objects avatars on virtual objects can be calculated by reconstructing the real objects from the light source’s viewpoint. The resulting depth buffer is converted into a texture to shadow VE geometry.
3.5 Performance Analysis
The visuall hull algorithm’s overall work is the sum of the work of the image segmentation and volume-querying stages. This analysis does not take into account the time and bandwidth costs of capturing new images, transferring the image data between processors, and the rendering of the virtual environment.
The image segmentation work is composed of computing object pixels. Each new camera image pixel is subtracted from a background pixel and the result compared against a segmentation threshold value at every frame. Given n cameras with u x v resolution, u*v*n subtract and compares are required.
The volume-querying work has both a graphics transformation and a fill rate load. For n cameras, rendering l planes with u x v resolution and divided into an i x j camera-distortion correction grid, the geometry transformation work is (2(n*i*j)+2)*l triangles per frame. Volume-querying each plane computes u * v point volume-queries in parallel. Since every pixel is rendered n+1 times per plane, the fill rate = (n+1)*l*u*v per frame.
Figure 5 – Geometry transformations per frame as a function of number of cameras planes (X) and grid size (Y). The SGI Reality Monster can transform about 1 million triangle per second. The nVidia GeForce4 can transform about 75 million triangles per second.
|
|
|
|
|
|
Figure 6 – Fill rate as a function of number of cameras, planes (X) and resolution (Y). The SGI Reality Monster has a fill rate of about 600 million pixels per second. The nVidia GeForce4 has a fill rate of about 1.2 billion pixels per second.
|
|
|
|
|
|
For reconstructing a one-meter deep volume at 1 centimeter spacing between the planes with three NTSC input cameras @ 30 Hz using a single field in a 320 x 240 window at fifteen frames per second, the image segmentation does 15.7 * 106 subtracts and segmentation threshold tests per second, 0.23 * 106 triangles per second are perspective-transformed, and the fill rate must be 0.46 * 109 per second.
The SGI Reality Monster can transform about 1.0 * 106 triangles per second and has a fill rate of about 0.6 * 109 pixels per second. The nVidia GeForce4 can transform about 75.0 * 106 million triangles per second and has a fill rate of about 1.2 * 109 pixels per second [Pabst02]. The fill rate requirements limits the number of planes with which we can sample the volume, which in turn limits the reconstruction accuracy. At 320 x 240 resolution with 3 cameras and reconstructing at 15 frames per second, on the SGI, we estimate one can use 130 planes, and on a GeForce4, 261 planes.
3.6 Accuracy Analysis
How closely the final rendered image of the virtual representation of a real object matches the actual real object has two separate components: how closely the shape matches, and how closely the appearance matches.
Sources of Error for Capturing Real Object Shape. The primary source of error in shape between a real object and its corresponding real-object avatar is due to the visual hull approximation of the real object’s shape. Fundamental to using the visual hull approaches, errors in real object shape approximation enforces a lower bounds of overall error, regardless of other sources of error. The difference in shape between the visual hull and the real object are covered in [Niem97]. For example, a 10 cm diameter sphere, viewed by 3 cameras located 2 meters away in the three primary axis, would have a point 1.26 cm outside the sphere still be within the sphere’s visual hull. For objects with convexity or did not have cameras views of significant extents on the object, the error would be greater.
We now consider the sources of error for the rendered shape of the visual hull of a real object.. The shape, Ifinal, is represented by a sample point set in 3-space, located on a set of planes.
The final equation shows that the final image of the visual hull is a combination of three primary components, the image segmentation (Equation 2), volume-querying (Equation 3), and visual hull sampling (Equation 4).
Equation 6 - Novel view rendering of the visual hull
![]()
Where:
Ifinal – Novel view of the visual hull of the real object
P – a 3-D point (3 x 1 vector) [meters]
p – 2-D projection of P (2 x 1 vector)
PS – Spacing between planes for plane sweep volume-querying [meters]
U – User’s pose (Tracker report for position and orientation, field of view, near plane, far plane), Um is the projection matrix defined by the user’s pose.
S – Novel view screen resolution (u x v) [pixels]
Ci – Camera i defined by its extrinsic {Ct translation (3 x 1 vector) and Cr rotation (3 x 3 matrix)} and intrinsic {Cd radial distortion (scalar), Cpp principal point (2 x 1 vector), Cf focal lengths (2 x 1 vector)} parameters, and Cs resolution (x x y). Cm is the projection (4 x 4 vector) matrix given the camera’s extrinsic and intrinsic parameters.
Li – Source camera image for camera i (x x y resolution) [pixels]
Oi – Object-pixel map for camera i (x x y resolution) [pixels]
Bi – Background image for camera i (x x y resolution) [pixels]
Ti – Segmentation threshold map for camera i (x x y resolution) [pixels]
There are three kinds of error for Ifinal , errors in shape, appearance, and location.
Image Segmentation. Here
is the equation for image segmentation again (Equation
2). For pixel j,
camera i

The errors in the image segmentation for a pixel come from three sources:
1) The difference in foreground object color with the background color is smaller than the segmentation threshold value
2) The segmentation threshold value is too large, and object pixels are missed – commonly due to high spatial frequency areas of the background
3) Light reflections and shadowing cause background pixels to differ by greater than the segmentation threshold value.
The incorrect segmentation of pixels results in the following errors of visual hull size:
1) Labeling background pixels as object pixels incorrectly increases the size of the visual hull
2) Labeling object pixels as background pixels incorrectly reduces the size of the visual hull or yields holes in the visual hull.
Errors in image segmentation do not contribute to errors in the visual hull location.
Our experience: We reduced the magnitude of the segmentation threshold values by draping dark cloth on most surfaces to reduce high spatial frequency areas, keeping lighting constant and diffuse, and using with foreground objects that were significantly different in color from the background. We used Sony DFW-500 cameras, and they had approximately a 2 percent color variation for the static cloth draped scene. During implementation we also found that defining a minimum and maximum segmentation threshold per camera (generated by empirical testing) helped lower image segmentation errors.
Volume-querying. We assume that the camera pixels are rectangular, and subject to only radial (and not higher-order) distortions. Here is the equation for the camera model (Equation 5) and volume-querying again (Equation 3).

P ' ~VHobject iff " i, ' j such that Oi , j = Cm, i-1 *P, Oi , j = 1
The next source of error is how closely the virtual volume that an object pixel sweeps out matches the physical space volume. This depends on the inverse of the camera matrix (Cm-1) that projects pixels from each camera’s image plane into rays in the world. The camera matrix is defined by the camera’s extrinsic parameters {Ct translation (3 x 1 vector) and Cr rotation (3 x 3 matrix)}, intrinsic parameters {Cd radial distortion (scalar), Cpp principal point (2 x 1 vector), Cf focal lengths (2 x 1 vector)}, and resolution Cs (x x y).
Given a camera location setup with a 1 cubic meter reconstruction volume, the primary factors that affect volume-querying accuracy are: camera rotation and camera resolution. The projection of the 3-D point onto the 2-D camera image plane is sensitive to rotation error. For example, 1 degree of rotational error in a dimension would in result in 5.75 cm error in the reconstruction volume.

The camera resolution determines the minimum size of a foreground object to be visualized. The undistorted 2-D projection of a 3-D point is eventually rounded into two integers that reference the camera’s object-pixel map. This rounding introduces error into volume-querying. Our cameras are located such that the largest distance from any camera to the farthest point in the reconstruction volume is 3.3 m. Given that we use one field of the NTSC-resolution cameras (720 x 243) with 24-degree FOV lenses, a pixel sweeps out a pyramidal volume with at most a base 0.58 cm by 0.25 cm.
Errors in camera calibration affect visual hull shape. The error in visual hull shape depends primarily on the error in camera rotation. The projection of this error into the volume gives us a lower limit on the certainty of a volume queried point. The effect on visual hull location is a bit more difficult to quantify. An error in camera calibration would cause object pixels to sweep out a volume not registered with the physical space sweeping from the camera’s image plane element through the lens and into the volume.
An error in a camera’s calibration will shift the projection of an object pixel, but this does not necessarily change the location of the visual hull. The erroneous portion of the volume being swept out will be unlikely to intersect the object pixel projections from the other cameras, and thus the visual hull would only decrease in size, but not move.
For example, suppose three cameras image a 7.5 cm cube foreground object. Assume that a camera, looking straight down on the cube from 2 meters away, had a 0.1-degree rotation error about some axis. The visual hull would decrease in size by about 4 mm in some world-space dimension. The error in one camera’s projection of the object pixels that represent the cube probably will not intersect all the other camera’s projection of the object pixels that represent the cube. In summary, calibration error would unlikely result in changing the visual hull location, as all the cameras would need to have a calibration error in such a way as to shift the object pixel projections in the same world space direction.
Observations: We placed the cameras as close to the working volume as possible. To determine each camera’s extrinsic parameters, we attached the UNC HiBall to a stylus and used it to digitize the camera’s location and points in the camera’s scene. From these points, we calculated the camera’s extrinsic parameters. The HiBall is sub-millimeter-accurate for position and 0.1-degree-accurate for rotation. From this, we estimate that the HiBall introduces about 1 pixel of error for the rotation parameters and sub-millimeter error for the position parameters. To estimate the camera’s internal parameters, we captured an image of a regular checkerboard pattern in the center of the reconstruction volume that took up the entire camera’s field of view. Then we used the stylus again to capture specific points on the checkerboard. The digitized points were overlaid on the captured image of the checkerboard and the intrinsic parameters were hand-modified to undistort the image data to match the digitized points. The undistorted points has about 0.5 cm of error for checkerboard points (reprojecting the pixel error into 3-space) within the reconstruction volume.
This 0.5 cm error for the center of the reconstruction volume is the lower bound for the certainty of the results for volume-querying a point. This error is also approximately the same magnitude as the error from projecting the HiBall’s orientation error (0.1 degrees) into the center of the reconstruction volume. This means there is an estimated 0.5 cm error for the edges of the visual hull shape, and an upper bound of 0.5 cm error for visual hull location, depending on the positions of cameras, and other foreground objects.
Plane Sweeping. Plane sweeping is sampling the
participant’s view frustum for the visual hull to generate a view of the visual
hull from the participant’s perspective.
The UNC HiBall is attached to the HMD and returns the user’s viewpoint
and view direction (U). The
tracker noise is sub-millimeter in position, and 0.1 degree in rotation. Projecting this into the space at arms-length,
results in the translation contributing 1 mm of error, and rotation
contributing 1.4 mm of error, both of which are well below the errors
introduced by other factors. The screen
resolution (S) defines the number of points the plane will volume query
(u x v). At the
arms length distance that we are working with and the 34 degree vertical FOV of
the HMD, the sampling resolution is 2 mm.
The primary factor that affects the sampling of the visual hull is the
spacing between the planes (PS), and its value is our estimate for error
from this step. Here is the equation for
plane sweeping again (Equation
4).
PS – Spacing between planes for plane sweep volume-querying [meters]
U – User’s pose (Tracker report for position and orientation, field of view, near plane, far plane)
S – Novel view screen resolution (u x v) [pixels]
f(U, S, k) – generates a plane that fills the entire viewport, a distance k from the user’s viewpoint
![]()
Observations: With our implementation, our plane spacing was 1.5 cm through the reconstruction volume. This spacing was the largest trade-off we made with respects to visual hull accuracy. More planes generated a better sampling of the volume, but reduced performance.
Sources of Error for Capturing Real Object Appearance. We texture mapped the reconstructed shape with a camera mounted on the HMD. The front mounted camera image was hand-tuned with interactive sliders in the application GUI to keep the textured image registered to the real objects. We did not calibrate this front camera. Doing a careful calibration would help in keeping the appearance in line with the reconstructed shape. We do not have an estimate for the appearance discrepancy between the real object and the textured visual hull.
Other Sources of Error. The shape and appearance of the final image of the real object differs from the real object by some error, E. E is composed primarily of errors from:
Equation 7 - Error between the rendered virtual representation and real object
· Lack of camera synchronization
· The difference between the estimated and actual locations of the participant’s eyes within the HMD
· End-to-end system latency
· Difference between the real object’s shape and the real object’s visual hull
Robject – Geometry of the real object
![]()
The cameras are not synchronized, and this causes reconstruction errors for highly dynamic real objects as data is captured at times that may differ by at most one frame time. At 30 frames per second, this is 33 milliseconds. Because of this, the reconstruction is actually being performed on data with varying latency. Objects that move significantly between the times the cameras’ images were captured will have virtual representations errors because each camera’s object pixels would sweep out a part of the volume that the object occupied at different times. In our experience the lack of camera synchronization was not noticeable, or at least was much smaller in magnitude than other reconstruction errors.
The transform from the HiBall to the participant’s eyes and look-at direction varies substantially between participants. We created a test platform that digitized a real object, and adjusted parameters until the participant felt that the virtual rendering of the test object was registered with the real object. From running several participants, we generated a transform matrix from the reported HiBall position to the participant’s eye position. We observed that for real objects at arms length varied in screen space by about ten pixels among several participants.
The end-to-end latency was estimated to be 0.3 seconds. The virtual representation that is rendered to the participant is the reconstruction of the object’s shape and appearance 0.3 seconds earlier. For objects of typical dynamics on a table top application, such as moving a block (~30 cm/sec), this results in the rendering of the visual hull to have up to 9 cm in translation error between the real object and the real-object avatar. The magnitude of the latency is such that participants recognize the latency and its effects on their ability to interact with both virtual and real objects. They compensated by waiting until the real-object avatars were registered with the real object.
Error Summary. The visual hull shape error is affected by image segmentation, volume-querying, and visual hull sampling. Each pixel incorrectly labeled in the image segmentation stage results in 0.5 cm error in the reconstruction volume. Camera calibration errors are typically manifested as reducing the size of the visual hull. Our estimates of using the HiBall and checkerboard pattern for calibration totals 0.5 cm of error. Finally, visual hull sampling at the 1.5 cm resolution for arms length introduced 1.5 cm of error to the visual hull shape. The estimated overall total error in the visual hull shape is 0.5 cm and the estimated error of the rendering of the visual hull is 1.5 cm.
The visual hull location error is affected only by the camera calibration. The visual hull location would only change if errors in camera calibration would cause the projection of object pixels from one camera that corresponded to one foreground object to intersect with the projection of object pixels from all other cameras of other foreground objects. The location of the visual hull is registered with respect to the HiBall’s reference frame as all the camera calibration was done with a single reference frame. One method to measure visual hull location error would be to digitize points on a foreground object, for example a cube, using the stylus with HiBall device. Then render the digitize points on top of the cube’s avatar and measure the difference. We believe that this value is quite small – too small to be noticed by the participant – and much smaller than visual hull shape error.
One practical test we used was to move our hand with finger (about 1 cm in diameter) extended around the reconstruction volume. We then examined the reconstruction width of the finger to observationally evaluate error. The finger reconstruction was relatively constant throughout most of the working volume. This is inline with our estimates of 0.5 cm error for the visual hull shape, and 1.5 cm error for rendering the visual hull.
3.7 Implementation
Hardware. We have implemented the reconstruction algorithm in a system that reconstructs objects within a 5-foot x 4-foot x 3-foot volume above a table top as shown in Figure 7.
Figure 7 – The overlaid cones represent each camera's field of view. The reconstruction volume is within the intersection of the camera view frusta.
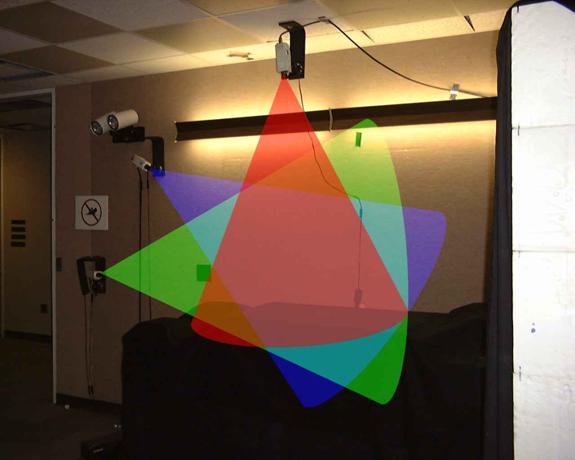
The system uses three wall-mounted NTSC cameras (720 x 486 resolution) and one camera mounted on a Virtual Research V8 HMD (640 x 480 resolution). One camera was mounted directly overhead, one camera to the left side of the table, and one at a diagonal about three feet above the table. The placing of the cameras was not optimal; the angles between the camera view directions are not as far apart as possible. Lab space and maintainability constrained this.
When started, the system captures and averages a series of five images for each camera to derive the background images. Since NTSC divides each frame into two fields, we initially tried having one image for each camera, updating whichever field was received from the cameras. For dynamic real objects, this caused the visual hull to have bands of shifted volumes due to reconstructing with interlaced textures. Our second approach captured one background image per field for each camera, and doing reconstruction per field. Unfortunately, this caused the virtual representations of stationary objects to move. Although the object was stationary, the visual hulls defined by the alternating fields were not identical, and the object appeared to jitter. We found the simple approach of always working with the same field – we chose field zero – was a compromise. While this increased the reconstruction error, latency was reduced and dynamic real objects exhibited less shearing.
The participant is tracked with the UNC HiBall, a scalable wide-area optical tracker mounted on the HMD as shown in Figure 8 [Welch97]. The image also shows the HMD mounted camera and mirror fixture used to texture the reconstruction.
Figure 8 – Virtual Research V8 HMD with UNC HiBall optical tracker and lipstick camera mounted with reflected mirror.
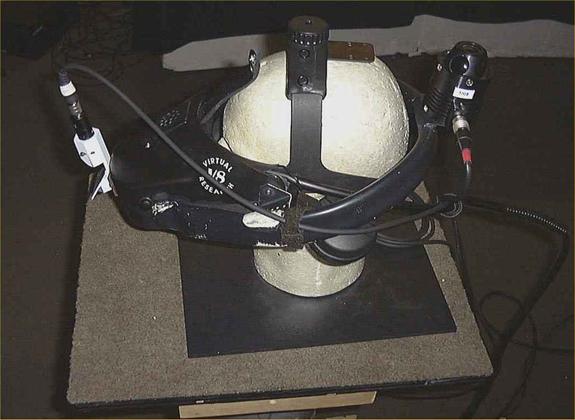
The four cameras are connected to Digital In – Video Out (DIVO) boards on an SGI Reality Monster system. Whereas PC graphics cards could handle the transformation and pixel fill load of the algorithm, the SGI’s video input capability, multiple processors, and its high memory-to-texture bandwidth made it a better solution when development first began.
In the past two years, other multiple camera algorithms have been implemented on a dedicated network of commodity PCs with cameras interfaced through Firewire. With the increase of PC memory to video card texture bandwidth through AGP 8X, porting the system to the PC is now a viable solution. The PC based systems also benefit from a short development cycle, speed upgrades, and additional features for new hardware. Also, the processor can now handle some operations, such as image segmentation.
The SGI has multiple graphics pipelines, and we use five pipes: a parent pipe to render the VE and assemble the reconstruction results, a video pipe to capture video, two reconstruction pipes for volume-querying, and a simulation pipe to run simulation and collision detection as discussed in Chapter 4. First, the video pipe obtains and broadcasts the camera images. Then the reconstruction pipes asynchronously grab the latest camera images, perform image segmentation, perform volume intersection, and transfer their results to the parent pipe. The number of reconstruction pipes is a trade-off between reconstruction latency and reconstruction frame rate, both of which increase with more pipes. The simulation pipe runs virtual simulations (such as rigid-body or cloth) and performs the collision detection and response tests. All the results are passed to the parent pipe, which renders the VE with the reconstructions. Some functions, such as image segmentation, are calculated with multiple processors.
The reconstruction is done into a 320 x 240 window to reduce the fill rate requirements. The results are scaled to 640 x 480, which is the resolution of VE rendering. The Virtual Research V8 HMD has a maximum resolution of 640 x 480 at 60 Hz.
Performance. The reconstruction system runs at 15-18 frames per second for 1.5 centimeter spaced planes about 0.7 meters deep (about 50 planes) in the novel view volume. The image segmentation takes about one-half of frame computation time. The reconstruction portion runs at 22-24 frames per second. The geometric transformation rate is 16,000 triangles per second, and the fill rate is 1.22 * 109 pixels per second. The latency is estimated at about 0.3 of a second.
The reconstruction result is equivalent to the first visible surface of the visual hull of the real objects, within the sampling resolution (Figure 9).
Figure 9 – Screenshot from our reconstruction system. The reconstructed model of the participant is visually incorporated with the virtual objects. Notice the correct occlusion between the participant’s hand (real) and the teapot handle (virtual).
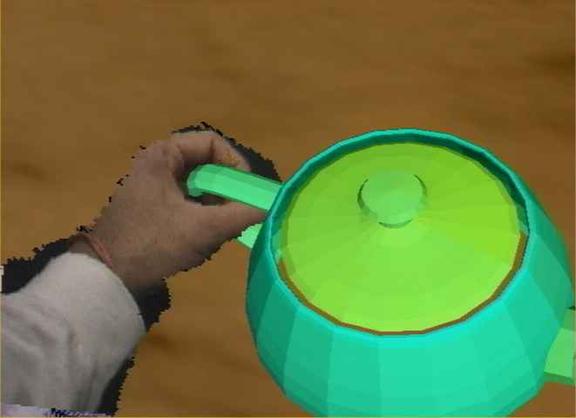
Advantages. The hardware-accelerated reconstruction algorithm benefits from the improvements in graphics hardware. It also permits using graphics hardware for detecting intersections between virtual models and the real-objects avatars. We discuss this in Chapter 4.
A significant amount of work can be avoided by only examining the parts of the real space volume that could contribute to the final image. Thus, only points within the participant’s view volume were volume queried.
The participant is free to bring in other real objects and naturally interact with the virtual system. We implemented a hybrid environment with a virtual faucet and particle system. The participant’s avatar casts shadows onto virtual objects and interacts with a water particle system from the faucet. We observed participants cup their hands to catch the water, hold objects under stream to watch particles flow down the sides, and comically try to drink the synthetic water. Unencumbered by additional trackers and intuitively interacting with the virtual environment, participants exhibit uninhibited exploration, often doing things we did not expect.
Disadvantages. Sampling the volume with planes gives this problem O(n3) complexity. Substantially large volumes would force a tradeoff between sampling resolution and performance. We have found for 1.5-centimeter resolution for novel view volumes 1 meter deep, reconstruction speed is real-time and reconstruction quality is sufficient for tabletop applications.
Visibility, or assigning the correct color to a pixel considering obscuration to the source cameras, is not easily handled by the hardware-based algorithm. Because we are interested in the first-person view of the real objects, this is not a problem since we use an HMD-mounted camera for a high-resolution texture map. For novel viewpoint reconstruction, such as in replaying an event or multi-user VEs, solving visibility is important. Using the discussed approaches of blended textures or textured depth-meshes show coloring artifacts. The IBVH work by Matusik computes both the model and visibility by keeping track of which source images contribute to a final pixel result [Matsuik00].
Conclusion. In this chapter, we presented a hardware-accelerated algorithm to capture real object shape and appearance. The virtual representations of real objects were then combined with virtual objects and rendered. In the next chapter, algorithms are presented to manage collisions between these virtual representations and virtual objects.
4. Collision Detection
Terminology.
Incorporating real objects –participants are able to see, and have virtual objects react to, the virtual representations of real objects
Hybrid environment – a virtual environment that incorporates both real and virtual objects
Object reconstruction – generating a virtual representation of a real object. It is composed of three steps, capturing real object shape, capturing real object appearance, and rendering the virtual representation in the VE.
Real object – a physical object
Dynamic real object – a physical object that can change in appearance and shape
Virtual representation – the system’s representation of a real object
Real-object avatar – same as virtual representation
Volume-querying – given a 3-D point, is it within the visual hull of a real object in the scene?
Novel viewpoint – a viewpoint and view-direction for viewing the foreground objects. Typically, this novel viewpoint is arbitrary, and not the same as that of any of the cameras. Usually, the novel viewpoint is the participant’s viewpoint.
Collision detection – detecting if the virtual representation of a real object intersects a virtual object.
Collision response – resolving a detected collision
Visual hull – virtual shape approximation of a real object
4.1 Overview
The collision detection and collision response algorithms, along with the lighting and shadowing rendering algorithms, enable the incorporation of real objects into the hybrid environment. This allows real objects to be dynamic inputs to simulations and provide a natural interface with the VE. That is, you would interact with virtual objects the same way as if the entire environment were real.
Besides including real objects in our hybrid environments visually, as was covered in Chapter 3, we want the real-object avatars to affect the virtual portions of the environment. For instance, as shown in Figure 10, a participant’s avatar parts a virtual curtain to look out a virtual window. At each simulation time-step, the cloth simulation is given information about collision between virtual objects and real-object avatars.
Figure 10 – A participant parts virtual curtains to look out a window in a VE. The results of detecting collisions between the virtual curtain and the real-object avatars of the participant’s hands are used as inputs to the cloth simulation.
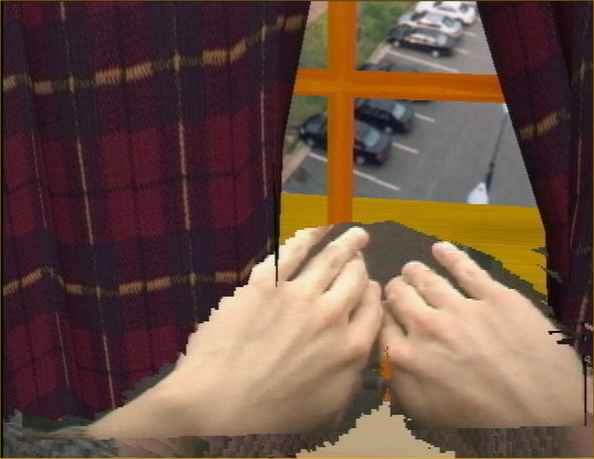
Thus we want real objects to affect virtual objects in lighting, shadowing, collision detection, and physics simulations. This chapter discusses algorithms for detecting collisions and determining plausible responses to collisions between real-object avatars and virtual objects.
The interaction between the real hand and virtual cloth in Figure 10 involves first upon detecting the collision between hand and cloth, and then upon the cloth simulation’s appropriately responding to the collision. Collision detection occurs first and computes information used by the application to compute the appropriate response.
We define interactions, as
one object affecting another. Given environments
that contain both real and virtual objects there are four types of interactions
we need to consider:
· Real-real: collisions between real objects are resolved by the laws of physics; forces created by energy transfers in the collision can cause the objects to move, deform, and change direction.
· Virtual-virtual: collisions between virtual objects are handled with standard collision detection packages and simulations determine response.
· Real-virtual: For the case of real objects colliding and affecting virtual objects, we present a new image-space algorithm to detect the intersection of virtual objects with the visual hulls of real objects. The algorithm also returns data that the simulation can use to undo any unnatural interpenetration of the two objects. Our algorithm builds on the volume-querying technique presented in Chapter 3.
· Virtual-real: We do not handle the case of virtual objects affecting real objects due to collisions.
· Primary rule: Real-object avatars are registered with the real objects.
· Virtual objects cannot physically affect the real objects themselves. We do not use any mechanism to apply forces to the real object.
· Therefore, virtual objects are not allowed to affect the real-object avatars’ position or shape.
· Corollary: Whenever real-object avatars and virtual objects collide, the application modifies only the virtual objects.
4.2
Visual Hull
Overview. Standard collision detection algorithms detect collisions among objects defined as geometric models. Our system does not explicitly create a geometric model of the visual hull in the reconstruction process. Thus we needed to create new algorithms that use camera images of real objects as input, and detect collisions between real-object avatars and virtual objects. The visual avatar algorithm in Chapter 3 never constructs a complete model of the real objects, but only volume queries points in the participant’s view frustum. Similarly, the collision algorithm tests for collisions by volume-querying with the virtual objects primitives.
The inputs to our real-virtual collision detection algorithm are a set of n live video camera images and some number of virtual objects defined traditionally by geometric boundary representation primitives. Our algorithm deals with triangle boundary representations of the virtual objects. We chose this since triangles are the most common representation for virtual objects, and since graphics hardware is specifically designed to accelerate transformation and rendering operations on triangles. The algorithm is extendable to other representations, but it is common to decompose those representations into triangles.
The outputs of the real-virtual collision detection algorithm are:
· Set of points on the boundary representation of the virtual object in collision with a real-object avatar (CPi).
The outputs of the collision response algorithm are estimates within some tolerance for:
· Point of first contact on the virtual object (CPobj).
· Point of first contact on the visual hull (CPhull).
· Recovery vector (Vrec) along which to translate the virtual object to move it out of collision with the real-object avatar.
· Distance to move the virtual object (Drec) along the recovery vector to remove it from collision.
· Surface normal at the point of first contact on the visual hull (Nhull).
Assumptions. A set of simplifying assumptions makes interactive-time real-virtual collision detection a tractable problem.
Assumption 1: Only virtual objects can move or deform as a consequence of collision. This follows from our restrictions on virtual objects affecting the real object. The behavior of virtual objects is totally under the control of the application program, so they can be moved as part of a response to a collision. We do not attempt to move real objects or the real-object avatars.
Assumption 2: Both real objects and virtual objects are considered stationary at the time of collision. Collision detection is dependent only upon position data available at a single instant in time. Real-object avatars are computed anew each frame. No information, such as a centroid of the visual hull, is computed and retained between frames. Consequently, no information about the motion of the real objects, or of their hulls, is available to the real-virtual collision detection algorithm.
A consequence of Assumption 2 is that the algorithm is unable to determine how the real objects and virtual objects came into collision. Therefore the algorithm cannot specify the exact vector along which to move the virtual object to return it to the position it occupied at the instant of collision. Our algorithm simply suggests a way to move it out of collision.
Assumption 3: There is at most one collision between a virtual object and the real object visual hull at a time. If the real object and virtual object intersect at disjoint locations, we apply a heuristic to estimate the point of first contact. This is due to our inability to backtrack the real object to calculate the true point of first contact. For example, virtual fork tines penetrating the visual hull of a real sphere would return only one estimated point of first contact. We move the virtual object out of collision based on our estimate for the deepest point of collision.
Assumption 4: The real objects that contribute to the visual hull are treated as a single object. Although the real-object avatar may appear visually as multiple disjoint volumes, e.g., two hands, computationally there is only a single visual hull representing all real objects in the scene. The system does not distinguish between the multiple real objects during collision detection. In the example, the real oil filter and the user’s hand form one visual hull. This is fine for that example – we only need to know if the mechanic can maneuver through the engine – but distinguishing real objects may be necessary for other applications.
Assumption 5: We detect collisions shortly after a virtual object intersects and enters the visual hull, and not when the virtual object is exiting the visual hull. This assumes the frame rate is fast compared to the motion of virtual objects and real objects. The consequence is that moving the virtual object along a vector defined in our algorithm will approximate backing the virtual object out of collision. This assumption might be violated, for example, by a virtual bullet shot into a thin sheet of real plywood.
Approach. There are two steps for managing the interaction of virtual objects with real-objects avatars. The first and most fundamental operation is determining whether a virtual object, defined by a set of geometric primitives representing its surface, is in collision with a real object, computationally represented by its visual hull volume.
For a virtual object and real object in collision, the next step is to reduce or eliminate any unnatural penetration. Whereas the simulation typically has additional information on the virtual object, such as velocity, acceleration, and material properties, we do not have this information for the real object, so we do not use any such information in our algorithm. Recall that we do not track, or have models of, the real object. To the reconstruction system, the real object is an occupied volume.
It is not possible to backtrack the real object to determine the exact time of collision and the points of first collision for the virtual object or the real object. If a collision occurred, it is not possible to determine how the objects came into collision, and thus we seek to recover only from any erroneous interpenetration. We only estimate the position and point of first contact of both objects. Only then does it make sense for the application to use additional data, such as the normal at the point of contact, or application-supplied data, such as virtual object velocity, to compute more physically accurate collision responses.
Figure 11 – Finding points of collision between real objects (hand) and virtual objects (teapot). Each triangle primitive on the teapot is volume queried to determine points of the virtual object within the visual hull (blue points).
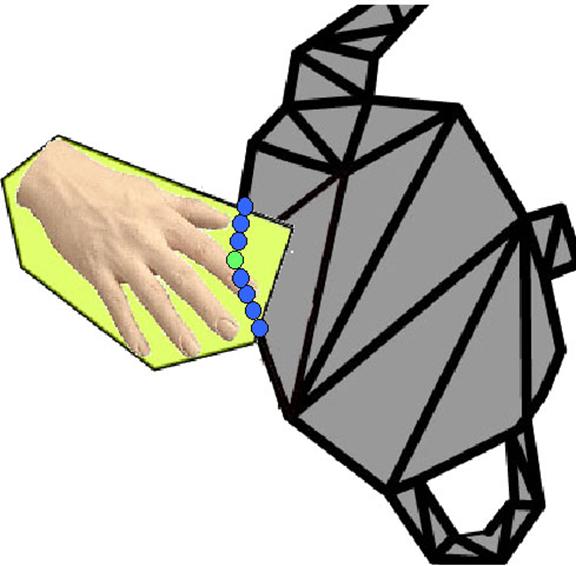
Algorithm Overview. The algorithm first determines if there is a collision, and if there is, sample and enumerate the points on the surface of the virtual object that are in the visual hull, the collision points, CPi, as shown as blue dots in Figure 11. From the set of collision points, we identify one collision point that is the maximum distance from a reference point, RPobj (typically the center of the virtual object), the virtual object collision point, CPobj, the green dot in Figure 11.
We want a vector and a distance to move CPobj out of collision. This is the recovery vector, Vrec, which is from CPobj towards the RPobj. Vrec intersects the visual hull at the hull collision point, CPhull. The distance, Drec, to move CPobj along Vrec is the distance between CPobj and CPhull. The final piece of data computed by our algorithm is the normal to the visual hull at CPhull, if it is needed. The following sections describe how we compute each of these values. In our discussion of the algorithm, we examine the collision detection and response of a single virtual object colliding with a single real object.
Finding Collision Points. Collision points, CPi, are points on the surface of the virtual object that are within the visual hull. As the virtual surfaces are continuous, the set of collision points is a sampling of the virtual object surface.
The real-virtual collision detection algorithm uses the fundamental ideas of volume-querying described in Chapter 3. Whereas in novel viewpoint reconstruction, we sample the visual hull by sweeping a series of planes to determine which parts of the plane are inside the visual hull, in collision detection we sample the visual hull with the geometric primitives, usually triangles, defining the surface of the virtual object to determine which parts of the primitive are inside the visual hull. If any part of any triangle lies within the visual hull, the object is intersecting a real-object avatar, and a collision has occurred. The novel viewpoint reconstruction surface is not used in collision detection, and the real-virtual collision detection algorithm is view independent.
As in the novel viewpoint
reconstruction, the algorithm first sets up n projected textures, one
corresponding to each of the n cameras and using that camera's image,
object-pixel map, and projection matrix.
Volume-querying each
triangle involves rendering the triangle n times, once with each of the
projected textures, and looking for any points on the triangle that are in
collision with the visual hull. If the
triangle is projected ‘on edge’ during volume-querying, the sampling of the
triangle surface during scan-conversion (getting the triangle to image space)
will be sparse and collision points could be missed. For example, rendering a sphere for volume-querying from any viewpoint will
lead to some of the triangles being projected on edge, which could lead to
missed collisions. The size of the
triangle also affects collision detection, as the volume-querying sampling would be closer for smaller triangles than
larger triangles. No one viewpoint and
view-direction will be optimal for all triangles in a virtual object. Thus, each triangle is volume queried in its
own viewport, with its own viewpoint and view-direction.
To maximize collision detection
accuracy, we wanted each triangle to fill its viewport as completely as
possible. To do this, the each triangle
is rendered from a viewpoint along the triangle’s normal, and a view direction
that is the inverse of the triangle’s normal.
The rendered triangle is orthonormal to the view direction, and the
viewpoint is set to maximize the size of the triangle’s projection in the
viewport. A larger viewport results in a
smaller spatial sampling frequency across the triangle’s surface, but at a cost
in performance.
Each virtual object triangle is
rendered into its own subsection of the frame buffer (Figure 12) n times, once with each camera’s object-pixel
map projected as a texture.
Pixels with a stencil value of n
correspond to points on the triangle that are in collision with the visual
hull.
Figure 12 – Each primitive is volume queried in its own viewport.
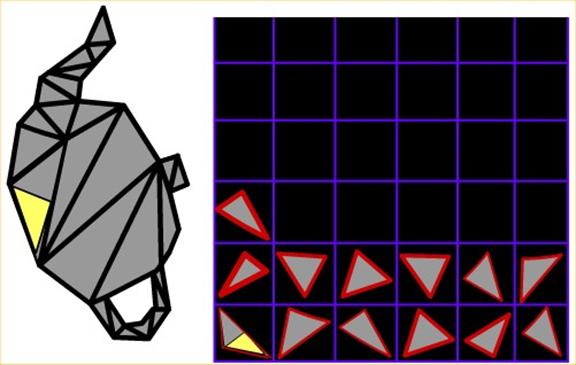
During each rendering pass a
pixel’s stencil buffer is incremented if the pixel is part of the triangle
being scan converted and that pixel is textured by a camera’s object
pixel. After the triangle has been
rendered with all n projected textures, the stencil buffer will have
values in the range of [0...n].
If, and only if, all n textures are projected onto a point, is
that point in collision with the visual hull (Figure 4 diagrams the visual hull of an object).
The frame buffer is read back and
pixels with a stencil value of n represent points of collision between
the visual hull and the triangle. We can find the coordinates of the 3-D point
by unprojecting the pixel from screen space coordinates (u, v, depth) to world
space coordinates (x, y, z). These 3-D
points form a set of collision points, CPi, for
that virtual object. This set of points
is returned to the virtual object simulation.
The real-virtual collision detection algorithm
returns whether a collision exists and a set of collision points for each
triangle. How a simulation utilizes this
information is application- and even object-dependent. This division of labor is similar to current
collision detection algorithms. Also,
like current collision detection algorithms, e.g. [Lin98], we provide a suite of tools to
move the virtual object out of collision with the real object.
Recovery From Interpenetration. We present one approach to use the collision information to compute a plausible collision response for a physical simulation. As stated before, the simplifying assumptions that make this problem tractable also make the response data approximations of the exact values. The first step is to move the virtual object out of collision.
We estimate the point of first contact on the virtual object CPobj to be the point of deepest penetration on the virtual object into the visual hull. We approximate this point with the collision point that is farthest from a reference point, RPobj, of the virtual object. The default RPobj is the center of the virtual object. As each collision point CPi is detected, its distance to RPobj is computed by unprojecting CPi from screen space to world space (Figure 13). The current farthest point is conditionally updated. Due to our inability to backtrack real objects (Assumption 2), this point is not guaranteed to be the point of first collision of the virtual object, nor is it guaranteed to be unique as there may be several collision points the same distance from RPobj. If multiple points are the same distance, we arbitrarily choose one of the points from the CPi set for subsequent computations.
Figure 13 – Diagram showing how we determine the visual hull collision point (red point), virtual object collision point (green point), recovery vector (purple vector), and recovery distance (red arrow).
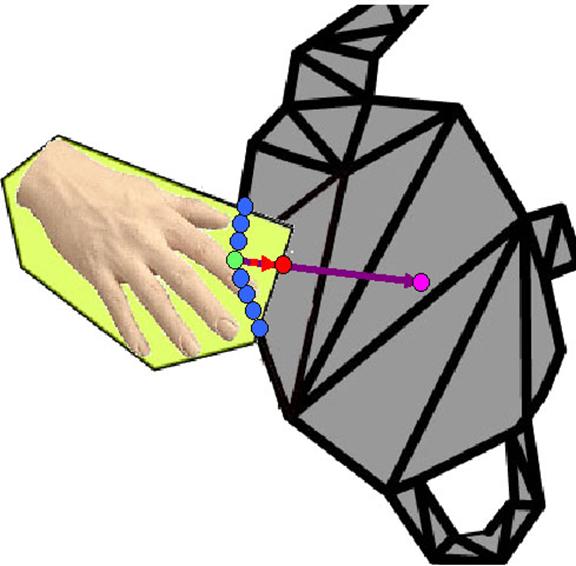
Recovery Vector. Given that the virtual object is in collision and our estimation of the deepest penetration point CPobj, we want to move the virtual object out of collision by the shortest distance possible. The vector along whose direction we want to move the virtual object is labeled the recovery vector, Vrec (Figure 13). Since we used the distance to RPobj in the estimation of CPobj, we define the recovery vector as the vector from CPobj to RPobj:
Equation 8 - Determining recovery vector
Vrec = RPobj - CPobj
This vector represents the best
estimate of the shortest direction to move the virtual object so as to move it
out of collision. This vector works well
for most objects, though the simulation can provide an alternate Vrec for certain virtual objects with constrained motion, such as
a hinged door, to provide better object-specific results. We discuss using a different Vrec in a cloth
simulation in the final section of this chapter.
Point
of First Contact on Visual
Figure 14 – By constructing triangle A (CPobj), BC, we can determine the visual hull collision point, CPhull (red point). Constructing a second triangle DAE that is similar to ABC but rotated about the recovery vector (red vector) allows us to estimate the visual hull normal (green vector) at that point.
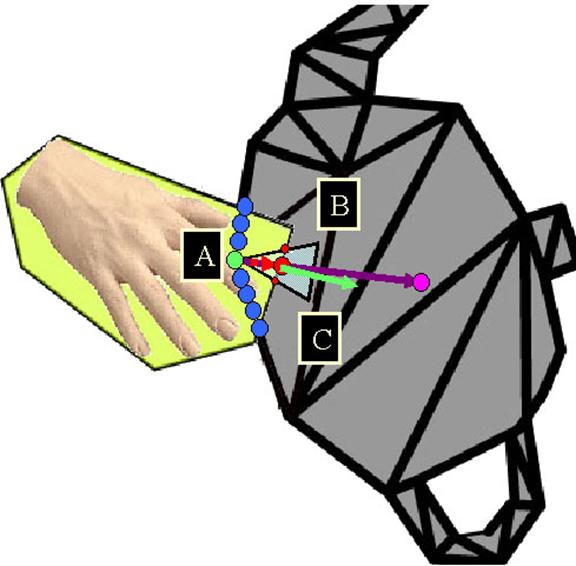
One
wants to search along Vrec
from RPobj until one finds CPhull. Given standard graphics hardware, which
renders lines as thin triangles, this entire search can be done by
volume-querying one triangle. First, we
construct an isosceles triangle ABC such that A = CPobj and the base, BC, is bisected by Vrec. Angle BAC (at
CPobj) is constructed to be
small (10 degrees) so that the sides of the triangle intersect the visual hull
very near CPhull. The height of the triangle is made relatively
large in world space (5 cm) so that the base of the triangle is almost
guaranteed to be outside the visual hull.
Then, we volume-querying the visual hull with the triangle ABC,
rendering it from a viewpoint along the triangle’s normal and such that Vrec lies along a scan line. The hull collision point is
found by stepping along the scan line corresponding
to Vrec, starting at the base
of the triangle, searching for the first pixel within the visual hull (stencil
buffer value of the pixel = n).
Unprojecting that pixel from screen to world space yields the CPhull. If the first pixel tested along the scan line
is in the visual hull, this means the entire triangle is inside the visual hull,
and we double the height of the triangle and iterate.
The recovery distance, Drec, is the distance between the CPobj and CPhull. This is not guaranteed to be the minimum separation distance as is found in some collision detection packages [Hoff01], rather it is the distance along vector Vrec required to move CPobj outside the visual hull and approximates the minimum separation distance.
Figure 15 – Sequence of images from a virtual ball bouncing off of real objects. The overlaid arrows shows the balls motion between images.
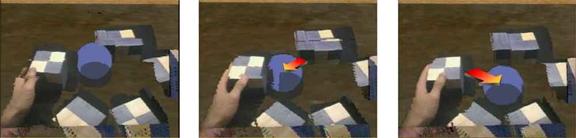
We first locate 4 points on the visual hull surface near CPhull and use them to define two vectors whose cross product gives us a normal to the visual hull at CPhull. We locate the first two points, I and J, by stepping along the BA and CA of triangle ABC, finding the pixels where these lines intersect the visual hull boundary, and unprojecting the pixels to get the world space coordinates of the two points. We then construct a second triangle, DAE, identical to ABC except in a plane roughly perpendicular to ABC. We locate points K and L by stepping along DA and EA, then cross the vectors IJ and KL, to produce the normal, Nhull.
Implementation. The psuedocode for a simulation cycle:
For each object i:
//virtual-virtual collision detection and
response (e.g. swift++)
Objecti-> Update();
//real-virtaul collision detection
iCollisionResult
= CollisionManager->DetectCollisions(Objecti);
//If
there are, resolve collisions
if
iCollisionResult == 1
CollisionManager->ResolveCollisions(Objecti);
The collision detection and response routines run on a separate simulation pipe on the SGI. At each real-virtual collision time-step, the simulation pipe performs the image segmentation stage to obtain the object-pixel maps.
To speed computation, collision detection is done between the visual hull and axis-aligned bounding boxes for each of the virtual objects. For the virtual objects whose bounding box was reported as in collision with the visual hull, a per-triangle test is done. If collisions exist, the simulation is notified and passed the set of collision points. The simulation managing the behavior of the virtual objects decides how it will respond to the collision, including if it should constrain the response vector. Our response algorithm then computes the recovery vector and distance. The surface normal is computed if the simulation requests that information.
4.3 Performance Analysis
Given n
cameras and virtual objects with m triangles and testing each triangle
in a u x v resolution viewport in a x x y resolution
window, the geometry transformation cost is (n * m) per
frame. The fill rate cost is (n*m*u*
v)/2. There is also a computational
cost of (x*y) pixel readbacks and compares to find pixels in
collision. For example, our curtain
hybrid environment, as shown in Figure 16, had 3 cameras with 720 triangles that made up the
curtains. We used 10 x 10 viewports in a
400 x 400 window for collision detection.
The collision detection ran at 6 frames per second. The geometry transformation was (3 * 720) * 6
Hz = 12960 triangles per second. The
fill rate is (3*720*10*10)/2 * 6 Hz = 648000 pixels per second. There are also 160,000 pixel readbacks and
compares.
For
collision response, the transformation cost is 2 triangles per virtual object
in collision. The fill rate is (x *
y * n) = (400 * 400 * 3) = 480,000 pixels per collision.
Even
though our implementation is not heavily
optimized, we can achieve roughly 13,000 triangles per second for collision
detection and response. This was a first
implementation of the algorithm, and there are many optimizations with regards
to minimizing OpenGL state changes that should improve the performance of the
algorithm as the current realized performance is substantially lower than the
theoretical performance possible on the SGI.
4.4 Accuracy Analysis
The collision detection accuracy
depends on image segmentation, camera models, and the size of the viewport into
which the primitives are rendered. The
error analysis for the image segmentation and camera models on the accuracy of
the visual hull is described in Chapter 3.6. In this
section, we analyze the effect of viewport size on the collision detection
accuracy. The larger the viewport for
collision detection, the more closely spaced the points on the triangle that
are volume-queried. Thus the spatial
accuracy of collision detection for:
u
x v – resolution of viewport
x
x y – size of bounding box of the triangle in world space.
We
assume a square viewport (having u = v makes it easier on the
layout of viewports in the framebuffer), and thus the collision detection
accuracy is x / u by y / u. That is since we project each triangle such
that it maximally fills the viewport (exactly half the pixels are part of the
triangle), the accuracy will be the two longest dimensions of the triangle
divided by the viewport horizontal size.
Primitives can be rendered at
higher resolution in larger viewports, producing a higher number of more closely
spaced collision points and less collision detection error. Also, a larger viewport means that fewer
number of triangles can be volume queried in the collision detection
window. If not all the primitives can be
allocated their own viewport in a single frame buffer, then multiple
volume-query and read-back cycles will needed so that all the triangles can be
tested.
Hence, there is a speed-accuracy
tradeoff in establishing the appropriate level of parallelism: the more viewports there are, the faster the
algorithm executes but the lower the pixel resolution available for the
collision calculation for each primitive.
Smaller viewports have higher parallelism, but may result in missed
collisions.
The size in world space of the
virtual object triangles will vary substantially, but for table top size
objects, the individual triangles would average around 2 cm per bounding box
side, which would have 0.2 cm x 0.2 cm collision point detection error. For example in our sphere example (Figure
15), the virtual sphere had 252 triangles and a radius
of 10 cm. The average size of a bounding
box for the triangle was 1.3 cm by 1.3 cm.
This would result in collision detection at a 0.13 cm resolution, which
is less than the errors in visual hull location and visual hull shape. The cloth system (Figure 16) had nodes 7.5 cm x 3 cm apart. The collision detection resolution was 0.75
cm x 0.3 cm. These values are the
spatial frequency for volume-querying
and provide the maximum error to finding a collision point.
For collision response, we examine
the computation of the CPhull
point, as this impacts the distance along the recovery vector, Drec, to back out the virtual object, and the uncertainty of the
Nhull vector. The
error in finding CPhull
along the Vrec given:
x x y resolution collision response window
l – length of the major axis of triangle ABC [meters]
We assume a square window, as this
is typically equal to the collision detection window. The accuracy for detecting CPhull is
l/x. Due to Assumption 5 (our
frame rate is comparable to the motion of the objects), we initially set l to
be 5 cm. That is we assume that there is
no more than 5 cm of interpenetration.
With the 400 x 400 window, this results in .0125 cm error for detecting CPhull. If there is more than 5 cm of penetration, we
double l (doubling the size of triangle ABC) and volume query
again. This also means that d Again, the
magnitude of these errors is substantially smaller than the error in the visual
hull location and visual hull shape.
The surface normal at CPhull, Nhull,
is calculated by performing a cross product of surface points a small distance
away from the CPhull.
How well these points actually represent the surface at CPhull depends
on the surface topology, the distance from these points to CPhull, and the
distance from CPhull
to CPobj, in addition to the errors in volume-querying detection. These surface points have a 0.0125 cm
detection error.
Thus we estimate the following errors
for the collision detection and response values, independent of any visual hull
shape and visual hull location errors.
We assume 2 cm virtual triangle size, 10 x 10 viewports, and 400x400
window.
Collision
points (CPi)– 0.75 cm error
Point
of first contact on the virtual object (CPobj)– 0.75 cm error
Point
of first contact on the visual hull given the collision points (CPhull) – 0.0125 cm
error
Distance
along recovery vector to move virtual object along – 0.0125 cm error
4.5 Algorithm Extensions
Figure 16 – Sequence of images taken from a VE where the user can interact with the curtains to look out the window
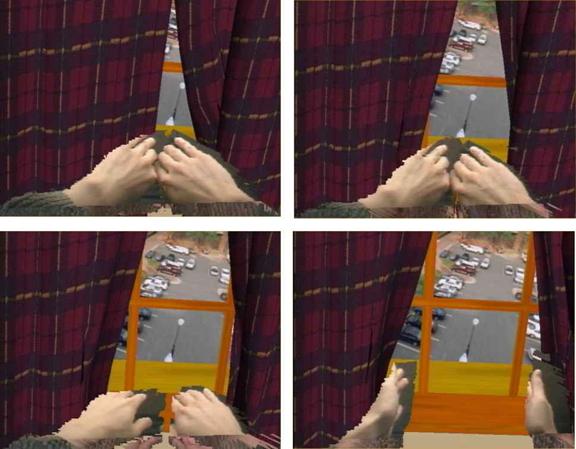
Collision Detection Extensions. Figure 16 is a sequence of frames of a user pushing aside a curtain with his hands. The collision response in this example shows the use of our algorithm with a deformable virtual object, the cloth. It further shows how the algorithm considers constraints in determining the direction of the Vrec. The cloth is simulated by a system of nodes in a mesh. To apply our algorithm to a deformable object, we consider each triangle independently, and individually detect collisions with real objects. For each triangle in collision, the calculated recovery vector and distance is passed to the cloth simulation as displacement vectors for the cloth simulation nodes. In the case of the curtains, we would like to constrain their motion to translation in the horizontal direction. So instead of computing a Vrec using the center of the object, we define a direction of motion and pass it to the algorithm. Now, when the objects move to get out of collision, the motion is primarily in the direction defined by the constraint vector.
The vector from CPobj to RPobj is the most likely estimate of how the virtual object came into contact with the visual hull. The object center need not always be the RPobj used. For example, we use the distance to the object center at the previous time-step as RPobj for highly symmetrical objects, such as spheres.
Volume-querying can be done with primitives other than surface boundarie, such as distance fields, to compute data. This proximity information can be visualized as thermal radiation of real objects onto virtual objects, magnetic fields of real objects, or barriers in a motion planning simulation.
The depth buffer from novel-viewpoint reconstruction can be converted into a polygonal mesh. We have incorporated these surfaces as collision objects in a particle system. As each reconstruction was completed, an updated surface was passed as a buffer to the particle system. Figure 17 shows a water particle system interacting with the user carrying a real plate. The user and the plate were reconstructed from a viewpoint above the table, and the resulting depth buffer was passed to the water particle system.
Figure 17 – The real-object avatars of the plate and user are passed to the particle system as a collision surface. The hand and plate cast shadows in the VE and can interact with the water particles.
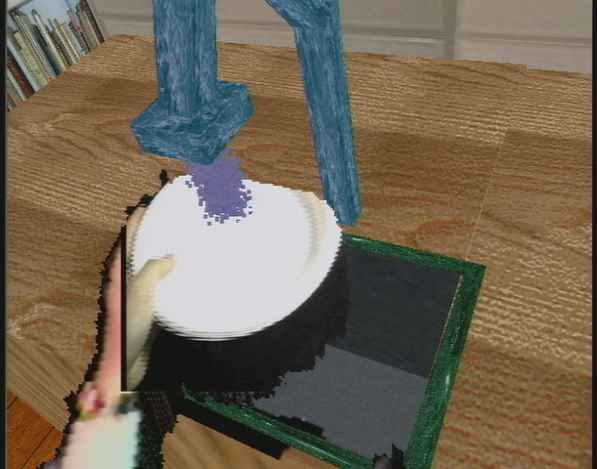
5. User Study
5.1 Purpose
Motivation. The purpose of this study was to identify the effects of interaction methodologies and avatar visual fidelity on task performance and sense-of-presence while conducting a cognitive manual task. We performed the study for two reasons. First, we are interested in what factors makes virtual environments effective. Second, we wished to evaluate a new system that enables natural interactions and visually faithful avatars.
The real-time object reconstruction system allows us to evaluate the effects of interacting with real objects and having visually faithful avatars on task performance and presence. Previously, these topics would have been difficult to study due to complexity of traditional modeling and tracking techniques.
First, our system lets us investigate how performance on cognitive tasks, i.e. time to complete, is affected by interacting with real versus virtual objects. The results will be useful for training and assembly verification applications, as they require the user to solve problems often while interacting with tools and parts.
Second, our system lets us investigate whether having a visually faithful avatar, as opposed to a generic avatar, increases sense-of-presence. The results will provide insight into the need to invest the additional effort to render a high fidelity visual avatar. This will be useful for designers of immersive virtual environments, such as phobia treatment and entertainment VEs that aim for high levels of participant sense-of-presence.
Background. The Effective Virtual Environments (EVE)
research group at the
The Virtual Environments and Computer Graphics research group at the University College London, led by Mel Slater, has conducted numerous user studies. Their results show that the presence of avatars increases self-reported user sense-of-presence [Slater93]. They further hypothesize that having visually faithful avatars rather than generic avatars would increase presence. In their experiences, Heeter and Welch comment that having an avatar improved their immersion in the VE. They then hypothesize that a visually faithful avatar would provide an improvement [Heeter92, Welch96].
We are interested in determining whether performance and sense-of-presence in VEs with cognitive tasks would significantly benefit from interacting with real objects rather than virtual objects.
VEs can provide a useful training, simulation, and experimentation tool for expensive or dangerous tasks. For example, in design evaluation tasks, users can quickly examine, modify, and evaluate multiple virtual designs with less cost and time in VEs than building real mock-ups. To do these tasks, VEs contain virtual objects that approximate real objects. Researchers agree that training with real objects would be more effective, but how much would interacting with and visualizing real objects help? Would the ability to interact with real objects have a sufficiently large effectiveness-to-cost ratio to justify its deployment?
5.2 Task
Design Decisions. In devising the task, we sought to abstract tasks common to VE design applications to make our conclusions applicable to a wide range of VEs. Through surveying production VEs [Brooks99], we noted that a substantial number of VE goals involve participants doing spatial cognitive manual tasks.
We
use the following definition for spatial tasks:
“The three major dimensions of spatial ability that are
commonly addressed are spatial orientation – mentally move or transform
stimuli, spatial visualization – manipulation of an object using oneself as
reference, and spatial relations – manipulating relationships within an object
[Satalich95]. “
Training and design review tasks executed in VEs typically have spatial components that involve solving problems in three dimensions.
“Cognition is a term used to describe
the psychological processes involved in the acquisition, organisation and use
of knowledge – emphasising the rational rather than the emotional
characteristics” [Hollnagel02].
The VE applications we aim to learn more about, typically contain a significant cognitive component. For example, layout applications have users evaluating different configurations and designs. Tasks that involve spatial and cognitive skills more than motor skills or emotional decisions may be found on some commonly used intelligence tests.
We specifically wanted to use a task that involves cognition and manipulation while avoiding tasks that primarily focus on participant dexterity or reaction speed for the following reasons:
- Participant dexterity variability would have been difficult to pre-screen or control. There was also the potential for dexterity, instead of interaction, to dominate the measures. The selected task should involve a minimal and easily understood physical motion to achieve a cognitive result.
- Assembly design and training tasks done in VEs do not have a significant dexterity or reaction-speed component. Indeed, the large majority of immersive virtual environments avoid such perceptual motor-based tasks.
- VE technical limitations on interactions would limit many reaction speed-based tasks. For example, a juggling simulator would be difficult to develop, test, and interact with, using current technology.
- Factors such as tracking error, display resolution and variance in human dexterity, could dominate results due to measuring and technical limitations. Identifying all the significant interaction and confounding factors would have been difficult.
The task we designed is similar to, and based on, the block design portion of the Wechsler Adult Intelligence Scale (WAIS). Developed in 1939, the Wechsler Adult Intelligence Scale is a test widely used to measure intellectual quotient, IQ [Wechsler39]. The WAIS is composed of two major components, verbal and performance, each with subsections such as comprehension, arithmetic, and picture arrangement. The block-design component measures reasoning, problem solving, and spatial visualization, and is a part of the performance subsection.
In the traditional WAIS block design task, participants manipulate small one-inch plastic or wooden cubes to match target patterns. Each cube has two faces with all white, two all red, and two half-white half-red divided diagonally. The target patterns are four or nine block patterns. Borders may or may not be drawn around the target pattern. The presence of borders affects the difficulty level of the patterns.
The WAIS test measures whether a participant correctly replicates the pattern, and awards bonus points for speed. There is a time limit for the different target patterns based on difficulty and size.
There were two reasons we could not directly use the block design subtest of the WAIS. First, because the WAIS test and patterns are copyrighted, the user study patterns are our own designs. Unlike the WAIS test, we administered a random ordering of patterns of relatively equal difficulty (determined with pilot testing), rather than a series of patterns with a gradually increasing level of difficulty.
Second, the small block size (one-inch cubes) of the WAIS would be difficult to manipulate with purely virtual approaches. The conditions that used the reconstruction system would be hampered by the small block size because of camera resolution and reconstruction accuracy issues. We therefore increased the block size to a 3” cube.
Figure 18 – Image of the wooden blocks manipulated by the participant to match a target pattern.
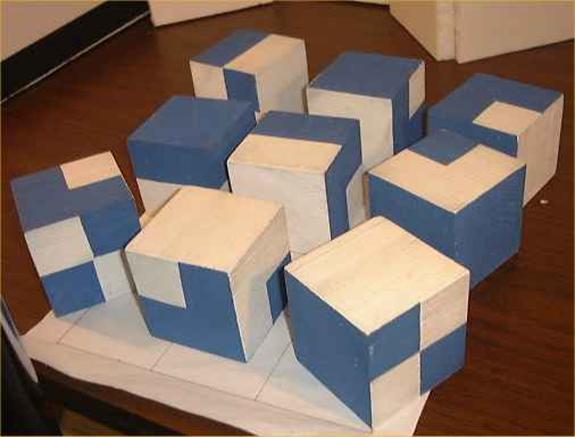
Task Description. Participants manipulated a number of 3”wooden blocks to make the top face of the blocks match a target pattern. Each cube had its faces painted with the six patterns shown in Figure 18. The faces represented the possible quadrant-divided white-blue patterns. The nine wooden cubes were identical.
There were two sizes of target patterns, small four block patterns in a two by two arrangement, and large nine block patterns in a three by three arrangement. Appendix A.9 shows the patterns used in the experiment.
We had two dependent variables. For task performance we measured the time (in seconds) for a participant to arrange the blocks to exactly match the target pattern. The dependent variable was the difference in a participant’s task performance between a baseline condition (real world) and a VE condition. For sense-of-presence, the dependent variable was the sense-of-presence scores from the presence questionnaire administered after the experience.
Design. The user study was a between-subjects
design. Each participant performed the
task in a real space environment (RSE), and then in one of three virtual
environment conditions. The independent
variables were the interaction modality (real or virtual blocks) and the avatar
fidelity (generic or visually faithful).
The three virtual environments have:
- Virtual objects with generic avatar (purely virtual environment - PVE)
- Real objects with generic avatar (hybrid environment - HE)
- Real objects with visually faithful avatar (visually-faithful hybrid environment – VFHE)
The task was accessible to all participants, and the target patterns were intentionally made to be of a medium difficulty. Our goal was to use target patterns that were not so cognitively easy as to be manual dexterity tests, nor so difficult that participant spatial visualization ability dominated the interaction modality effects.
Pilot Study. In April 2001, Carolyn Kanagy and I conducted a pilot test as part of the UNC-Chapel Hill PSYC130 Experiment Design course.
The purpose of the pilot study was to assess the experiment design and experiment conditions for testing the effect of interaction modality and avatar fidelity on task performance and presence. The subjects were twenty PSYC10 students, fourteen males and six females. The participants ranged from 18 - 21 years old and represented a wide variety of college majors.
Each participant took a test on spatial ability and did the block manipulation task on four test patterns (two small, and two large patterns) in a real environment (RSE) and then again in either a purely virtual (PVE) or visually faithful hybrid environment (VFHE). These experimental conditions is described more fully in Chapter 5.3. We present here the pilot test results.
For each participant, we examined the difference in task performance between the real and purely virtual or between the real and visually faithful hybrid environments. Thus we were looking at the impedance the virtual environment imposed on task performance. Table 1 shows the average time difference between the VE performance (purely virtual or visually-faithful hybrid) and the real space performance.
Table 1 – (Pilot Study) Difference in Time between VE performance and Real Space performance
|
|
Average Time Difference Small Patterns |
Average Time Difference Large Pattern |
|
Purely Virtual Environment – Real Space Environment |
23.63 seconds |
100.05 seconds |
|
Visually-Faithful Hybrid Environment – Real Space Environment |
8.95 seconds |
40.08 seconds |
We performed a two-tailed t-test and found a significant difference in the impedance of task performance compared to the real space task performance, between the two conditions [t = 2.19 , df = 18, p<0.05 (small patterns), t = 3.68, df = 18, p<0.05 (large patterns)]. Therefore we concluded that the two types of interaction (with real or virtual blocks) produced different levels of performance drop-off on task performance from real-space performance. Specifically, manipulating purely virtual objects within a VE created a substantially greater decrement in performance than did manipulating real objects within a VE.
We administered questionnaires for sense-of-presence during the VE experience. They were not found to be significantly different between the two conditions. We were surprised that the visually faithful avatars did not result in an increased sense-of-presence as the visual fidelity and kinematic fidelity of the avatars were substantially higher in the VFHE condition over the PVE condition.
We also administered questionnaires on simulator sickness. There was not a significant difference between the two conditions’ effect on simulator sickness.
Although the task performance in the visually faithful hybrid environment was significantly closer to the real space environment than the purely virtual environment, we did not know whether the performance improvement was because of realistic avatars, interacting with real objects, or a combination of both. This led us to develop a third condition for the final user study that had the user manipulate real objects but with a generic avatar.
In the pilot study, the difference in task performance mean appears to be very strong, but because the variance in task performance among subjects was high the significance level of the t test was just marginally significant. We therefore wished to design the final study in order to reduce this unwanted variability. Fortunately, the spatial ability test suggested a way to do this.
Participants in the pilot study also took the Guilford-Zimmerman Aptitude Survey, Part 5: Spatial Orientation. Spatial ability was the strongest covariate (r = -0.41) with task performance. This result suggested that if we controlled for spatial ability variability in participants, we would get stronger, more useful results. Further supporting this was the fact that those with poor spatial aptitude scores were more likely to be unable to complete the target patterns at all. We were unable to use the data from those participants who could not complete all the test patterns.
Our pilot study experiences led us to modify the experiment design in the following ways:
- We included an additional condition to separate avatar fidelity from interaction modality effects.
- We modified the real world task to operate in an enclosed space to match more closely training and design tasks that would require the user to manipulate objects not in a direct line of sight.
- Upon consulting with Mel Slater and reviewing literature [Slater99], we changed the presence questionnaire from the Witmer-Singer Presence Questionnaire to the Steed-Usoh-Slater Presence Questionnaire [Usoh00].
- We controlled for people with high spatial aptitude by requiring participants to have taken a Calculus 1 or equivalent course. Cognitive psychology professor Edward Johnson advised us that spatial aptitude and enrollment in higher-level mathematics courses correlate strongly. Widely variable spatial aptitude resulted in large standard deviations in task performance for the pilot experiment.
- We learned that participants were wary that their performance was being compared to others’ performance. Prior to the final study, we explained to participants that we were comparing each participant’s VR performance to his real space performance and not to other participants’ performance.
And specifically for variance dampening:
- We randomized the assignment of the target patterns to conditions to help reduce the inter-pattern difficulty variability skewing our results. In the pilot study, the sets of target patterns assigned to the real and to the virtual condition were identical for each participant. This had the undesired effect of having a particularly difficult or easy pattern always affecting the same condition and in biasing results. Although we performed pilot testing to try to create equally difficult patterns, the relative difficulty was not known.
- We lengthened the task training. We noted that the task had a definite learning effect that we were not interested in measuring. A longer practice session in the real space helped reduce the standard deviations in performance for all conditions below those seen in the pilot study.
The pilot study provided us invaluable experience in understanding the factors that contributed to task performance. This resulted in much stronger results in the final user study.
The pilot study also made us aware of the effect of unevenly balanced patterns skewing scores in either in real space or the VE condition. Thus before the main study, we performed testing to select patterns of relatively equal difficulty. Five volunteers were timed on a suite of large and small patterns. Any patterns that were consistently different than a person’s average time were discarded. We had on hand extra patterns of equal difficulty to the test and practice suite of patterns in case of some anomaly.
From the set of patterns, a random ordering was generated for each participant. Each pattern would appear as either a practice or test pattern in either the real space or VE condition. All participants saw the same twenty patterns (ten practice, ten test), just in different orders.
5.3 Final Study Experiment Conditions
Each participant performed the block pattern-matching task in an enclosed real space environment (RSE) without any VE equipment. Next, they performed the same task in one of three virtual environments: purely virtual (PVE), hybrid (HE) , or visually-faithful hybrid (VFHE). Figure 19 shows the different environments participants performed the block-manipulation task.
Figure 19 – Each participant performed the task in the RSE and then in one of the three VEs.
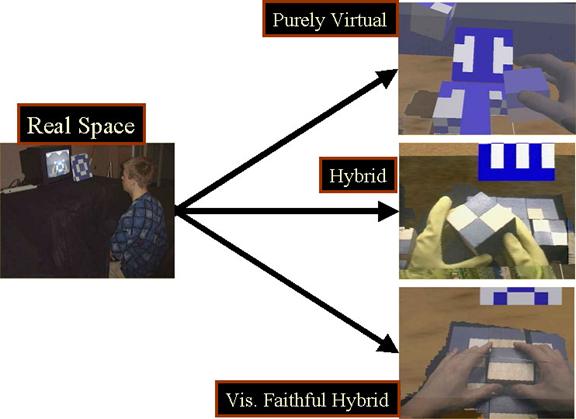
The participants were randomly assigned to one of the three
groups, 1) RSE then PVE, 2) RSE then HE, or 3) RSE then VFHE.
Real Space Environment (RSE). In the real space environment (RSE), the participant sat at a desk as shown in Figure 20. On the desk were the nine wooden blocks inside a rectangular 36” x 25” x 18” enclosure. The side facing the participant was open and the whole enclosure was draped with a dark cloth. Two small lights lit the inside of the enclosure.
Figure 20 – Real Space Environment (RSE) setup. The user watches a small TV and manipulates wooden blocks to match the target pattern.
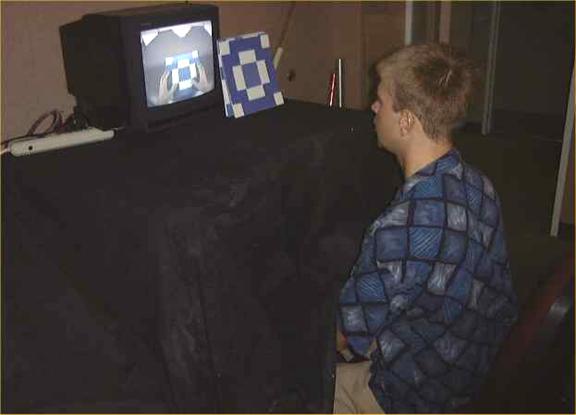
A 13” television placed atop the enclosure displayed the video feed from a “lipstick camera” mounted inside the enclosure. The camera had a similar line of sight as the participant. The participant performed the task while watching the TV. The target pattern was placed next to the TV.
RSE Equipment: Real blocks, TV, lipstick camera, cloth-draped enclosure, small lights.
Purely Virtual Environment (PVE). In the purely virtual environment (PVE), participants stood at a four-foot high table. The table surface was centered in the reconstruction volume. As shown in Figure 21, participants wore Fakespace Pinchgloves, each tracked with Polhemus Fastrak magnetic trackers, and a Virtual Research V8 head-mounted display (HMD).
|
Figure 21 – Purely Virtual Environment (PVE) setup. The user wore tracked pinchgloves and manipulated virtual objects.
|
Figure 22 – PVE participant's view of the block manipulation task.
|
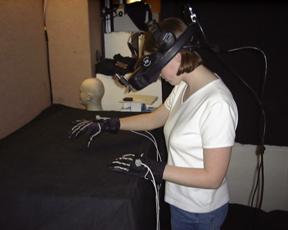
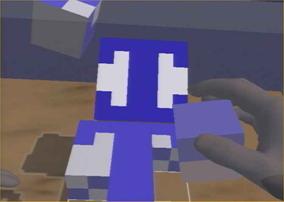
The gloves acted like a
switch. When the participant pinched two
fingers together (such as the thumb and forefinger), the gloves signaled the
system to pick up a virtual object, and a grasping hand avatar was
rendered. When the participant released
the pinch, the gloves signaled the system to drop the virtual object in hand,
and the open hand avatar was rendered.
Participants manipulated virtual blocks with a generic avatar. The block closest to an avatar’s hand was highlighted. This informed the participant that if he or she were to pinch, the highlighted block would be grasped.
If the participant pinched while a virtual block was highlighted, the virtual block snapped into the virtual avatar’s hand so that the hand appeared to be holding the block. To rotate the block, the participant rotated his hand while maintaining the pinching gesture.
If the participant released the block within six inches of the workspace surface, the block snapped (with both translation and rotation) into an unoccupied position in a three by three grid. This snapping removed the need for fine-grained interaction that might have artificially inflated the time to complete the task. If the block was released a few inches away from the grid, it simply dropped onto the table. If the block was released more than six inches above the table, the block floated in mid-air. This floating facilitated rotating virtual blocks faster. There was no inter-block collision detection and block interpenetration was not resolved, and participants typically resolved any block interpenetration if it occurred.
The target pattern was rendered as a card within the environment. The PVE program ran at a minimum of twenty frames per second. Figure 22 shows a screenshot of the images the participant saw.
PVE Equipment:
Fakespace Pinchgloves, Polhemus Fastrak trackers, Virtual Research V8 HMD. All the
virtual environments conditions were rendered with the SGI Reality Monster
graphics supercomputer housed in Sitterson Hall at the
Hybrid Environment (HE). In the hybrid environment
(HE), the participants stood at the same table as in the PVE. They wore the same V8 HMD and yellow
dishwashing gloves as shown in Figure
23. The
participant did not wear any special equipment or trackers, as the
reconstruction system generated real-time virtual representations of the user
and the blocks. The physical and virtual setups were similar to the PVE.
|
Figure 23 – Hybrid Environment (HE) setup. Participant manipulated real objects while wearing dishwashing gloves to provide a generic avatar.
|
Figure 24 – HE participant's view of the block manipulation task.
|
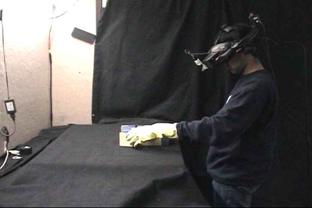
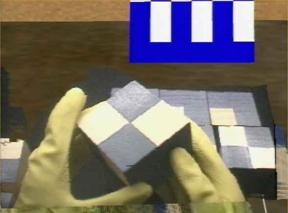
Real blocks, identical to those in the RSE, were manipulated as both the participant and the blocks were incorporated into the VE by using the real-object reconstruction system. The HMD displayed a reconstruction of the participant within the VE, texture mapped with images from a HMD mounted camera. All participants saw an avatar with generic appearance and accurate shape because they were wearing identical dishwashing gloves. The HE and VFHE ran at a minimum of twenty frames per second, and the reconstruction algorithm ran at a minimum of twelve frames per second. Figure 24 shows a screenshot of the images the participant saw.
HE Equipment: Real blocks, HMD with mounted lipstick camera (with a similar line-of-sight as the user), three wall-mounted cameras for reconstruction system, dishwashing gloves.
Visually-Faithful Hybrid Environment (VFHE). The visually-faithful-hybrid environment (VFHE), as shown in Figure 25, was similar to the HE except the participants did not wear gloves.
|
Figure 25 – Visually Faithful Hybrid Environment (VFHE) setup. Participants manipulated real objects and were presented with a visually faithful avatar.
|
Figure 26 – VFHE participant's view of the block manipulation task.
|
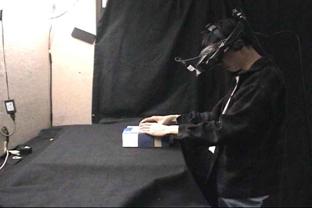
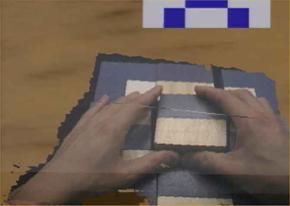
The avatar representation was visually faithful to the person as the shape reconstruction was texture mapped with images from a HMD mounted camera. The participant saw an image of his own hands, warts and all. Figure 26 shows a screenshot of the images the participant saw.
VFHE Equipment: Real blocks, HMD with mounted lipstick camera, three wall-mounted cameras for reconstruction system.
Virtual Environment. In all three of the virtual conditions (PVE, HE, VFHE), the VE was composed of a table inside a room with a corresponding real Styrofoam table that is registered to the same space. The room was a relatively generic room with a radiosity-as-textures global illumination solution as shown in Figure 27. The room was populated with several virtual objects, including a lamp, plant, and painting of the Mona Lisa. The enclosure in the RSE was also rendered in the VE, but instead of being obscured by cloth, it was rendered with transparency to allow the participants to see into it.
Figure 27 – Virtual environment for all three (PVE, HE, VFHE) conditions.
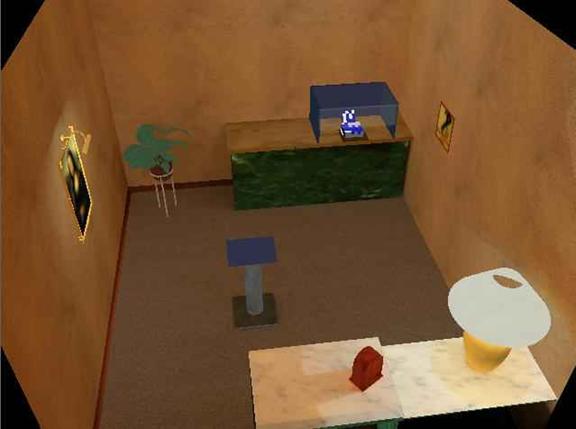
Rationale for Conditions. We expected that a
participant’s performance in a real environment, with real blocks and no VE
equipment, would produce the best results, as the interaction and visually
fidelity were both optimal. Thus we compared how close the task performance
in the three virtual environments was to the RSE task performance. We compared the reported sense-of-presence in the three other environments to each other.
We used the RSE for task training to reduce variability in individual task performance and as a baseline. This is because the block design task had a definite learning curve. The more patterns a participant did, the better at doing them they became. We found that most participants required two to three practice patterns of each size to get performance to a stable level. Doing the task in the RSE allowed participants to practice there, as opposed to spending additional time in the VE. We wanted to limit time in the VE to less than fifteen minutes, since many pilot subjects began complaining of fatigue after that amount of time in the VE.
People who were good or poor at the task in the RSE likely carried that aptitude into the VE condition. To reduce variability in the task performance measures, we examined the relative difference between a participant’s performance in the RSE and his performance in the VE condition, rather than comparing absolute performances between the VE conditions.
The PVE represented the way things are usually done with current technology. All the objects were virtual, and interactions were accomplished with specialized equipment and gestures. The difference in task performance between the RSE and the PVE corresponded to the additional impedance of interacting with virtual objects.
The HE was used to separate the effects on task performance afforded by interacting with real objects and by being provided a visually-faithful visual representation. Participants interacted with real objects but saw a generic avatar through wearing visually-similar dish-washing gloves.
The VFHE allowed us to evaluate the cumulative effect of both natural interactions and high visual fidelity on performance and presence. We were interested in seeing how close participants’ performance in our reconstruction system would be to their ideal RSE performance.
5.4 Measures
Audio, video, and
written notes were recorded for all participants. Anonymity was maintained for all participants
through the use of anonymous IDs throughout the experiment and data analysis.
Task Performance Measures. For task performance, we
measured the time each participant took to replicate correctly the target pattern.
We also recorded if the participant incorrectly concluded that they had
correctly replicated the target pattern.
In such cases, the experimenter informed the subject of the error and
the subject continued to work on the problem.
Each participant eventually correctly completed every pattern.
Sense-of-presence Measures. For sense-of-presence, participants answered the Steed-Usoh-Slater Presence Questionnaire (SUS) [Usoh00] after completing the task in the VE condition.
Other Factors. To observe the correlation of spatial ability with task performance, we administered the Guilford-Zimmerman Aptitude Survey, Part 5: Spatial Orientation. To assess the level of discomfort or simulator sickness, the Kennedy – Lane Simulator Sickness Questionnaire was given before and after the experience. This let us see if any of the different environments significantly affected simulator sickness.
Participant Reactions. At the end of the session, we interviewed each participant on their impressions of their experience. Finally, we recorded self-reported and experimenter-reported behaviors.
Subject Information. Forty participants completed the study, thirteen
each in the purely virtual environment (PVE) and hybrid environment (HE)
groups, and fourteen in the visually-faithful hybrid environment (VFHE)
group. There were two participants who
could not complete the experiment due to equipment problems, one due to errors
in data recording, and one due to nausea in the PVE. We did not use their data in computing
results.
The participants were primarily male (thirty-three males and eight females) undergraduate students enrolled at UNC (thirty-one undergraduates, three masters students, three PhD students, one staff member, and two spouses of fellow grad students). Participants were recruited through short presentations in UNC undergraduate Computer Science courses and word of mouth.
The participants had little (fewer than two prior sessions) immersive virtual reality experience. They reported their prior VR experience as Mean = 1.37 (standard deviation = 0.66, min = 1, max = 4) on a scale from 1 (Never before) to 7 (A great deal).
Most participants reported they use a computer a great deal. They reported their computer usage as M = 6.39 (s.d. = 1.14, min = 3, max = 7) on a scale from 1 (Not at all) to 7 (Very much so).
Participants were asked, during the past three years, what was the most they played computer and video games. Most reported between one to five hours a week, M=2.85 (s.d. = 1.26, min = 1, max = 5) on the following scale (1. Never, 2. Less than 1 hour per week, 3. Between 1 and 5 hours per week, 4. Between 5 and 10 hours per week, 5. More than 10 hours per week).
There were no significant differences between the groups in previous VR experience, computer usage, or video game play.
During the recruiting process, we listed the following restricting factors.
- Participants must be ambulatory (able to
walk without assistance) and have use of both hands.
- Participants must have 20/20 vision in both
eyes or as corrected.
- Participants cannot have a history of epilepsy,
seizures, or strong susceptibility to motion sickness
- Participants must be able to comfortably
communicate in spoken and written English.
- Participants cannot have significant
previous experience (more than two sessions) with virtual reality systems.
- Participants must have taken or be currently
enrolled in a higher-level mathematics course (Math31, Calculus of
Functions of One Variable, or equivalent).
This second set of criteria was verified at the beginning of the session.
- Participants
must be in their usual states of good fitness at the time of the
experiment (i.e., participants are excluded if they have used sedatives,
tranquilizers, decongestants, anti-histamines, alcohol, or other
significant medication within 24 hours of the session).
- Participants must be comfortable with the
HMD display, and must easily fit the HMD on their heads.
5.5 Experiment Procedure
The study was conducted over three days, and for convenience with respect to setup and equipment, each day’s participants were assigned to a specific study condition. The participants did not have prior knowledge about the experiment of its condition, and thus the overall effect was a random assignment of participants to conditions.
Each participant went through a one-hour session that involved three stages:
· Pre-experience – forms and questionnaires were filled out
· The experience –
o First a block design task in the RSE
o Then in one of PVE, HE, or VFHE
· Post-experience – debriefing, and more questionnaires were filled out
Upon arriving, all
participants read and signed a consent form (Appendix A.1).
All participants then went through a final screening where they completed a questionnaire designed to gauge their physical and mental condition (Appendix A.2). This was to establish the participants were not physically compromised in a way that might affect their task performance. Three participants in the HE condition reported having had more than three alcoholic drinks in the past 24 hours. We examined their task performance measures and noted that not considering their data in our statistical analysis did not change the statistical significance of the overall results. Thus, we did not throw out their data.
Next, the Kennedy-Lane Simulator Sickness Questionnaire (Appendix A.3) was given. The same questionnaire was administered after the experience to assess the effects of the VE system on the participants’ physical state.
Finally, the participants were given a spatial ability test, The Guilford-Zimmerman Aptitude Survey Part 5: Spatial Orientation (Appendix A.4). The participant read the instructions and did practice problems for a five-minute period, then answered as many multiple choice questions as possible in a ten-minute period. This test enabled us to correlate spatial ability with the task performance measures.
Real Space. After completing the pre-experience
stage, the participant entered the room with the real space environment (RSE)
setup. The participant was presented with the set of nine painted wooden
blocks. The participant was told that
the blocks are all identical. The video
camera was shown, the cloth lowered, and the TV turned on. The participant was told that they would be
manipulating the blocks while viewing the blocks and their hands by watching
the TV. The participant was instructed
to manipulate the blocks until the pattern showing on the top face of the
blocks duplicated a series of target patterns.
The participant was also told that we would record the time it took them
to correctly complete each pattern. The
participant was instructed to examine the blocks and become comfortable with
moving them.
When the participant
understood the procedure, they were given a series of six practice patterns,
three small (2x2) and then three large (3x3) patterns. The participant was told how many blocks are
involved in the pattern and to notify the experimenter when he thought he had
correctly reproduced the pattern. When
the practice patterns were completed the first test pattern was presented. Recall that the order of the patterns that
each participant sees is unique, though all participants see the same twenty
patterns (six real space practice, six real space timed, four VE practice, four
VE timed).
We recorded the time
required to complete each test pattern correctly. If the participant misjudged the completion
of the pattern, we noted this as an error and told the participant to attempt
to fix the errors without stopping the clock.
The final time was used as the task performance measure for that
pattern. Between patterns, the
participant was asked to randomize the blocks’ positions and orientations. The task continued until the participant had
completed all six timed test patterns, three small and three large.
Virtual Space. The experimenter helped the
participant put on the HMD and any additional equipment particular to the
particular VE condition (PVE – tracked pinch gloves, HE – dishwashing
gloves). Following a period of adaptation to the VE, the participant practiced
performing the task on two small and two large patterns. The participant then was timed on two small
and two large test patterns.
Participants were told they could ask questions and take breaks between patterns if they desired. Only one person (a PVE participant) asked for a break.
Post Experience. After completing the task, the participants were interviewed about their impressions of and reactions to the session. The debriefing session was a semi-structured interview as the specific questions asked (attached as Appendix A.6) were only starting points, and the interviewer could delve more deeply into responses for further clarification or to explore unexpected conversation paths. In the analysis of the post-experience interviews, we used axial coding to identify trends and correlate responses to shed light on the participants’ subjective evaluation of their experiences [XXX]. When reviewing the trends, note that not every participant has a response to every question that could be categorized. In fact, most participants spent much of the interview explaining to us how they felt the environment could be improved, regardless of the question.
Next, participants filled out the simulator sickness questionnaire again. By comparing their pre- and post-experience scores, we could assess if their level of simulator sickness had changed while performing the task (Appendix A.7).
Finally, a modified Slater – Usoh – Steed Virtual Presence Questionnaire (Appendix A.8) was given to measure the participants' level of presence in the VE.
Managing Anomalies. If the head tracker lost tracking or crashed, we quickly restarted the system (estimated to be about 5 seconds). In almost all the cases, the participants were so engrossed with the task they never noticed any problems and continued working on the task. We noted long tracking failures, and participants who were tall (which gave our aging HiBall tracker problems) were allowed to sit to perform the task. None of the tracking failures appeared to significantly effect the task performance time.
On hand was a set of additional patterns for replacement of voided trials, such as if a participant dropped a block onto the floor. This was used twice, and the substitutions were noted.
Statistical Analysis. The independent variables are the different VE conditions (purely virtual, hybrid, and visually-faithful hybrid). To look for differences in participant task performance between these three conditions, the dependent variable was the difference in the time to correctly replicate the target pattern in the VE condition compared to the RSE. To look for differences in participant sense-of-presence measures, the dependent variable is the sense-of-presence score of the Steed-Usoh-Slater Presence Questionnaire.
We use a two-tailed t-test to determine if the disparity in
the observed values between groups is due to chance or to an actual difference
between the conditions. The T-test and
the related p-value describe this likelihood. It is common to accept results as a
significant difference in the observed factor if the observed p-values
are less than a 0.05 level. This level,
called the a value, represents the chance that we are making a Type 1 error (labeling
a result as significant even though the true state is to the contrary). We use an a=0.05 level for significance unless otherwise
stated. At this level there is a 95%
probability that the observed difference between the means was due to an actual
difference of the factor in the conditions rather than to chance.
5.6 Hypotheses
Task Performance: Participants who manipulate real objects will complete a spatial cognitive manual task in less time than will participants who manipulate corresponding virtual objects.
Sense-of-presence: Participants represented in the VE by a visually faithful self-avatar will report a higher sense-of-presence than will participants represented by a generic self-avatar.
Associating Conditions with Hypotheses.
- Our first hypothesis was that the difference in task performance between both the hybrid environment (HE) and visually-faithful hybrid environment (VFHE), and the real space environment (RSE), would be smaller than the difference in performance between the purely virtual environment (PVE) and RSE, i.e. interacting with real objects improved task performance.
- Our second hypothesis was that self-reported sense-of-presence in the VFHE would be higher than in either the PVE or HE, i.e. avatar visual fidelity increased sense-of-presence.
- Further, we expected no significant difference in task performance for participants in the VFHE and HE conditions, i.e. interacting with real objects improved task performance regardless of avatar visual fidelity.
- Finally, we expected no significant difference in sense-of-presence for participants in the HE and PVE conditions, i.e. generic hand avatars would have similar effects on presence regardless of the presence of real objects.
5.7 Results
Task Performance. The task performance results are in Appendix B.1
Table 2 – Task Performance Results
|
|
Small Pattern Time (seconds) |
Large Pattern Time (seconds) |
||||||
|
|
Mean |
S.D. |
Min |
Max |
Mean |
S.D. |
Min |
Max |
|
Real Space (n=40) |
16.81 |
6.34 |
8.77 |
47.37 |
37.24 |
8.99 |
23.90 |
57.20 |
|
Purely Virtual (n=13) |
47.24 |
10.43 |
33.85 |
73.55 |
116.99 |
32.25 |
70.20 |
192.20 |
|
Hybrid (n=13) |
31.68 |
5.65 |
20.20 |
39.25 |
86.83 |
26.80 |
56.65 |
153.85 |
|
|
28.88 |
7.64 |
20.20 |
46.00 |
72.31 |
16.41 |
51.60 |
104.50 |
Table 3 – Difference in Task Performance between VE condition and RSE
|
|
Small Pattern Time (seconds) |
Large Pattern Time (seconds) |
||
|
|
Mean |
S.D. |
Mean |
S.D. |
|
Purely Virtual - Real Space |
28.28 |
13.71 |
78.06 |
28.39 |
|
Hybrid – Real Space |
15.99 |
6.37 |
52.23 |
24.80 |
|
Visually Faithful Hybrid – Real Space |
13.14 |
8.09 |
35.20 |
18.03 |
Figure 28 – Difference between VE and RSE performance for Small Patterns. The lines represent the mean difference in time for each VE condition.
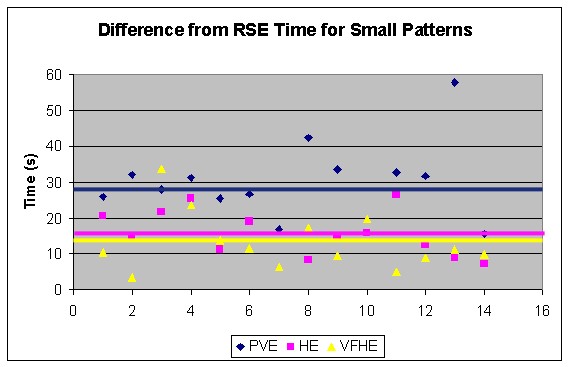
Figure 29 – Difference between VE and RSE performance for Large Patterns. The lines represent the mean difference in time for each VE condition.
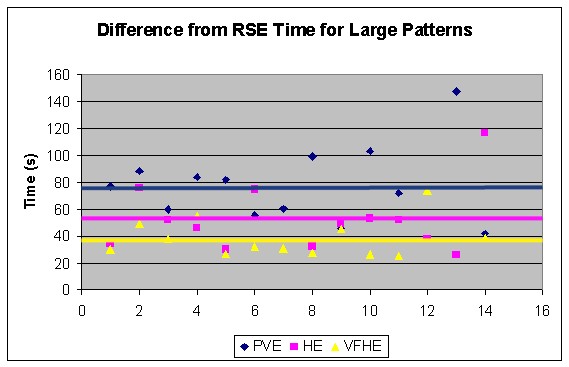
Table 4 – Between Groups Task Performance Comparison
|
|
Small Pattern |
Large Pattern |
||
|
|
t – test with unequal variance |
p – value |
t – test with unequal variance |
p - value |
|
PVE – RSE vs. VFHE – RSE |
3.32 |
0.0026** |
4.39 |
0.00016*** |
|
PVE – RSE vs. HE – RSE |
2.81 |
0.0094** |
2.45 |
0.021* |
|
VFHE – RSE vs. HE – RSE |
1.02 |
0.32 |
2.01 |
0.055+ |
* - significant at the a=0.05 level
** - significant at the a=0.01 level
*** - significant at the a=0.001 level
+ - requires further
investigation
For small patterns, both
VFHE and HE task performance was significantly better than PVE task
performance. For large patterns, both
VFHE and HE task performance was significantly better than PVE task performance
(Table 2). The
difference in task performance between the HE and VFHE was not significant at
the a=0.05 level (Table 4).
Performing the
block-pattern task took longer in any virtual environment than it did in real
space: The purely virtual environment
participants took 2.84 (small patterns) and 3.23 (large patterns) times
as long as they did in the real space (Table 3).
The performance
difference between the real space environment and the virtual environment was
less for hybrid environment and visually-faithful hybrid environment
participants: HE participants took 2.16 and 2.55 times as long, and the VFHE
took only 1.92 and 2.04 times as long as shown in Table 5.
Table 5 – Relative Task Performance Between VE and RSE
|
|
Small Pattern |
Large Pattern |
||||||
|
|
Mean |
S.D. |
Min |
Max |
Mean |
S.D. |
Min |
Max |
|
Purely VE / RSE |
2.84 |
0.96 |
0.99 |
4.66 |
3.23 |
0.92 |
2.05 |
5.03 |
|
Hybrid VE / RSE |
2.16 |
0.60 |
1.24 |
3.07 |
2.55 |
0.75 |
1.63 |
4.13 |
|
Visually Faithful Hybrid VE / RSE |
1.92 |
0.65 |
1.16 |
3.71 |
2.04 |
0.59 |
0.90 |
3.42 |
In the SUS Presence
Questionnaire, the final question asked how well the participants thought they
achieved the task, on a scale from 1 (not very well) to 7 (very well). The VFHE (5.43) and PVE (4.57) groups were
significantly different (t27 = 2.23, p=0.0345) at the a=0.05 level.
Table 6 – Participants' Response to How Well They Thought They Achieved the Task
|
How well do you think you achieved the task? (1..7) |
||
|
|
Mean |
S.D. |
|
Purely Virtual Environment |
4.57 |
0.94 |
|
Hybrid Environment |
5.00 |
1.47 |
|
Visually Faithful Hybrid Environment |
5.43 |
1.09 |
Sense-of-presence. The complete sense-of-presence results are in Appendix B.B.
We augmented the
standard Steed-Usoh-Slater Presence Questionnaire with two questions that
focused on the participants’ perception of their avatars. The entire questionnaire is included as
Appendix A.6.
- How much did you associate with the visual representation of yourself (your avatar)? During the experience, I associated with my avatar (1. not very much, 7. very much)
- How realistic (visually, kinesthetically, interactivity) was the visual representation of yourself (your avatar)? During the experience, I thought the avatar was (1. not very realistic, 7. very realistic)
Table 7 – Steed-Usoh-Slater Sense-of-presence Scores for VEs
|
|
Total Sense-of-presence Score Scale from 0..6 |
|||
|
|
Mean |
S.D |
Min |
Max |
|
Purely VE |
3.21 |
2.19 |
0 |
6 |
|
Hybrid VE |
1.86 |
2.17 |
0 |
6 |
|
Visually Faithful Hybrid VE |
2.36 |
1.94 |
0 |
6 |
Figure 30 – Raw Steed-Usoh-Slater Sense-of-presence Scores. The horizontal lines indicate means for the VE conditions. Note the large spread of responses.
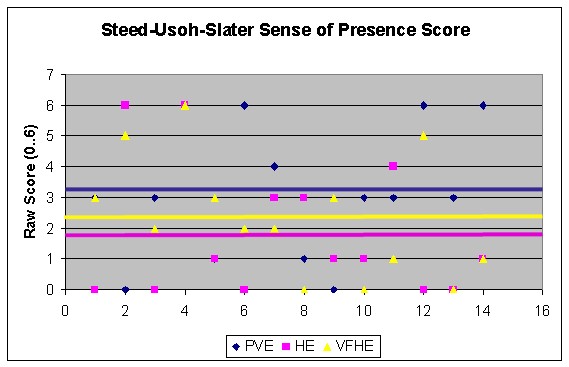
Table 8 – Steed-Usoh-Slater Avatar Questions Scores
|
|
Association with avatar 1. Not very much… 7. Very much |
Avatar realism 1. Not very realistic… 7. Very realistic |
||||||
|
|
Mean |
S.D. |
Min |
Max |
Mean |
S.D. |
Min |
Max |
|
Purely VE |
4.43 |
1.60 |
1 |
6 |
3.64 |
1.55 |
1 |
7 |
|
Hybrid VE |
4.79 |
1.37 |
2 |
6 |
4.57 |
1.78 |
2 |
7 |
|
Visually Faithful Hybrid VE |
4.64 |
1.65 |
2 |
7 |
4.50 |
1.74 |
3 |
7 |
Table 9 – Comparing Total Sense-of-presence Between Conditions
|
|
Between Groups Total Sense-of-presence |
|
|
|
t – test with unequal variance |
p – value |
|
PVE – VFHE |
1.10 |
0.28 |
|
PVE – HE |
1.64 |
0.11 |
|
VFHE – HE |
0.64 |
0.53 |
Other Factors. Simulator sickness was not significantly
different between the groups at the a = 0.05 level.
The complete results are included as Appendix
B.5.
Spatial ability was not
significantly different between groups as show in Table 10. The complete
spatial ability test results are included as Appendix
B.6. This shows
that the groups were not biased by the base spatial ability skills of
participants. Spatial ability was
moderately correlated (r = -0.31 for small patterns, and r =
-0.38 for large patterns) with performance.
Table 10 – Simulator Sickness and Spatial Ability Between Groups
|
|
Between Groups Simulator Sickness |
Between Groups Spatial Ability |
||
|
|
t – test with unequal variance |
p – value |
t – test with unequal variance |
p – value |
|
PVE vs. VFHE |
1.16 |
0.26 |
-1.58 |
0.13 |
|
PVE vs. HE |
0.49 |
0.63 |
-1.41 |
0.17 |
|
VFHE vs. HE |
-0.57 |
0.58 |
0.24 |
0.82 |
5.8 Discussion
Task Performance.
Task Performance Hypothesis: Participants who manipulate real objects will complete a cognitive manual task in less time than will participants who manipulate corresponding virtual objects.
For the case we
investigated, interacting with real objects provided a quite substantial
performance improvement over interacting with virtual objects for cognitive
manual tasks. Although task
performance in all the VE conditions was substantially worse than in the real
space environment, the task performance of hybrid and visually-faithful hybrid
participants was significantly better than for purely virtual environment
participants.
There is a slight
difference between HE and VFHE performance (Table 4, p=0.055), and we do not have a hypothesis as to the
cause of this result. This is a
candidate for further investigation.
These results showing significantly poorer task performance when interacting with purely virtual objects leads us to believe that the same hindrances would affect practice, training, and learning the task.
Handling real objects makes task performance and
interaction in the VE more like the actual task.
Sense of Presence.
Sense-of-presence Hypothesis: Participants represented in the VE by a visually faithful self-avatar will report a higher sense-of-presence than will participants represented by a generic self-avatar.
Although interviews
showed visually faithful avatars (VFHE condition) were preferred, there was no
statistically significant difference in reported sense-of-presence compared to those presented a generic avatar (HE
and PVE).
There were no
statistically significant differences at the a=0.05 level between any of the conditions for all
eight sense-of-presence questions. There
were no differences when examining the individual questions or the sum total sense-of-presence score.
Based on a study, Slater cautions against the use of the SUS Questionnaire to compare presence across virtual environment conditions, but also points out that no current questionnaire seems to support such comparisons [Slater00]. Just because we did not see a presence effect with the SUS Questionnaire does not mean that there was none.
Participant
Interviews. An observation from
the post-experience interviews showed that many participants in the purely
virtual condition note that the “avatar moved when I did” and gave a high mark
to the avatar questions. Some in the
visually faithful avatar condition said, “Yeah, I saw myself” and gave an
equally high mark to the avatar questions.
This resulted in similar scores to the questions on avatar realism.
In hindsight, the
different components of the self-avatar (appearance, movement, and
interactivity) should perhaps have been divided into separate questions. Regardless of condition, the participant
response had a movement first, appearance second trend. From this, we hypothesize kinematic
fidelity of the avatar is more important than visual fidelity for
sense-of-presence. Developing
techniques to determine the effect of visual fidelity, separate from dynamic
fidelity, on sense-of-presence, could
be an area of future research, but we believe this might prove to not be very
fruitful as we believe the additional impact of visual fidelity is not very
strong..
Debriefing Trends. We list here the major trends and discuss all trends in more detail later.
- When asked about the virtual representation of their bodies, PVE and HE participants commented on the fidelity of motion, while VFHE participants commented on the fidelity of appearance. This leads us to hypothesize that appearance fidelity seems to include motion fidelity.
- Participants in all groups responded that they were almost completely immersed when performing the task.
- Participants in all groups responded that they felt the virtual objects in the room (such as the painting, plant, and lamp) improved their sense-of-presence, even though they had no direct interaction with these objects.
- Participants in all groups responded that seeing an avatar improved their sense-of-presence.
- 7 out of 27 VFHE and HE participants mentioned that tactile feedback of working with real objects improved their sense-of-presence.
The following interview trends consistent with results of previous research or our experiences with VEs:
- Being involved in a task heightened sense-of-presence.
- Interacting with real objects heightened sense-of-presence [Insko01].
- System latency decreased sense-of-presence [Meehan01].
Debriefing Results –
Major Trends. A better picture
of the effect of the visually faithful avatars and interacting with real
objects can be drawn from the debriefing responses of the participants.
Participants presented
with generic avatars, the PVE and HE conditions, remarked that the motion
fidelity of the avatars contributed to their sense-of-presence. In fact,
all comments on avatar realism from PVE and HE conditions related to motion
accuracy.
- “Once I got used to where the hands were positioned… it felt like they were my hands.”
- “It was pretty normal, it moved the way my hand moved. Everything I did with my hands, it followed.”
- “They followed my motions exactly, I thought”
- “I thought they behaved pretty well. I didn't feel like I was looking at them, though. I felt I was using them more like a pointer, than the way I would look at my own hands.”
- "The only thing that really gave me a sense of really being in the virtual room was the fact that the hands moved when mine moved, and if I moved my hand, the room changed to represent that movement."
- "Being able to see my hands moving around helped with the sense of ‘being there’."
On the other hand, many, but not all, of the VFHE
participants explicitly commented on the visual fidelity of the avatars as an
aid to presence. In fact, all comments on avatar realism from VFHE related to visual
accuracy.
- “Nice to have skin tones, yes (I did identify with them)”
- "Yeah, those were my hands, and that was cool... I was impressed that I could see my own hands"
- "My hands looked very realistic… Yeah, they looked very real."
- “Appearance looked normal, looked like my own hands, as far as size and focus looked absolutely normal… I could see my own hands, my fingers, the hair on my hands”
From the interviews, participants who saw a visually faithful avatar assumed that the movement would also be accurate. From this we hypothesize that for VE users, visual fidelity subsumes kinetic fidelity.
Many participants reported that while engaged in the task, they believed completely they were in the presented virtual environment. In all the environments, head tracking and seeing other objects populating the virtual environment were the most commonly reported as factors that added to the presence.
Perhaps two quotes from the participants sum up the reconstructed avatars best:
- “I thought that was really good, I didn't even realize so much that I was virtual. I didn't focus on it quite as much as the blocks. “
- “I forget… just the same as in reality. Yeah, I didn't even notice my hands.”
Debriefing Results – Minor Trends.
- Among the HE and VFHE participants, 75% noticed the reconstruction errors and 25% noticed the reconstruction lag. Most in the HE and VFHE complained of the limited field of view of the working environment. Interestingly, the RSE had a similar limited working volume and field of view, but no participant mentioned it.
- 65% of the VFHE and 30% of the HE participants noted their avatar looked real.
- 93% of the PVE and 13% of the HE and VFHE participants complained that the interaction with the blocks was unnatural.
- 25% of the HE and VFHE participants felt the interaction was natural.
When asked what increased their sense-of-presence in the VE:
- 26% of the HE and VFHE participants said that having the real objects and tactile feedback increased their sense-of-presence.
When asked what decreased their sense-of-presence in the VE:
- 43% of PVE participants commented that the blocks not being there or behaving as expected reduced their sense-of-presence.
- 11% of HE and VFHE participants also mentioned that manipulating real objects decreased their sense-of-presence because “they reminded them of the real world.”
Finally, participants were asked how many patterns they needed to practice on before they felt comfortable interacting with the virtual environment. Based on their responses, VFHE participants felt comfortable significantly more quickly than PVE participants (T26 = 2.83, p=0.0044) at the a=0.01 level. Participants were comfortable with the workings of the VE almost an entire practice pattern earlier (1.50 to 2.36 patterns).
Observations.
- Two-handed interaction greatly improved performance over one-handed interaction.
- All participants quickly developed a partitioning algorithm to assist them in solving the patterns. Participants would mentally grid the target pattern into either 4 or 9 squares. Then for each target pattern subsection, participants would grab a block and try to locate the matching face.
- The typical methodology for manipulation was to pick up a block, rotate it to a different orientation, and check if the new face is the desired pattern. If not, rotate again. If it is, place the block and get the next block. The interactions to rotate the block dominated the difference in times between VE conditions.
- The next most significant component of task performance was the selection and placement of the blocks. Both these factors were improved through the natural interaction, motion constrains, and tactile feedback of real blocks.
Interesting Results. Using the pinch gloves had some unexpected fitting and hygiene consequences in the fourteen-participant PVE group.
- The pinch gloves are a one-size-fits-all, and two members had large hands and had difficulty fitting into the gloves.
- Two of the participants had small hands and had difficulty registering pinching actions because the gloves’ pinch sensors were not positioned appropriately.
- One participant became nauseated and had to quit the experiment before finishing all the patterns. He mentioned fatigue and a reported a high level of simulator sickness. The pinch gloves quickly became moist with his sweat. This was a hygiene issue for subsequent participants.
Some PVE participants physically mimicked their virtual avatar’s motions. Initially, they easily pinched to pick up virtual blocks. Recall that visually, the participants would see their virtual hand half-close to grab a virtual block as shown in Figure 32, when physically their hand would be making a pinching motion as shown in Figure 31. Some participants began to make the same hand motion that they saw, instead of the pinching motion required to select a block as shown in Figure 33. This caused no selection to be made and confused the participant. We noticed this phenomenon in the pilot study. In the main study, when the experimenter observed this behavior, he reminded the participant to make pinching motions to grasp a block.
|
Figure 31 – The PVE pinching motion needed to select a block.
|
Figure 32 – Images that participant saw when grabbing a block.
|
Figure 33 – Some participants started grasping midway, trying to mimic what they saw.
|
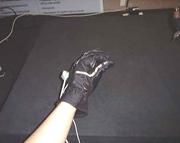

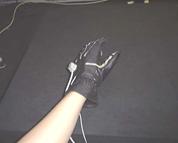
The PVE embodied several interaction tricks to provide an easy shortcut for some common tasks. For example, blocks would float in midair if the participant released the block more than six inches above the table. This eased the rotation of the block and allowed a select, rotate, release mechanism similar to a ratchet wrench. Participants, in an effort to maximize efficiency, would grab blocks and place them all in midair before the beginning of a test pattern. This allowed easy and quick access to blocks. The inclusion of the shortcuts was carefully considered to assist in interaction, yet led to adaptation and learned behavior that might be detrimental for training tasks.
In the RSE, participants worked on matching the mentally subdivided target pattern one subsection at a time. Each block was picked up and rotated until the desired face was brought into view. Some participants noted that this rotation could be done so quickly that they could just randomly spin each block to find a desired pattern.
In contrast, two PVE and one HE participant remarked that the slower interaction of grabbing and rotating a block in the VE influenced them to memorize the relative orientation of the block faces to improve performance.
Manipulating real objects also benefited from natural motion constraints. Tasks such as placing the center block into position in a nine-block pattern and closing gaps between blocks were easily done with real objects. In the PVE condition (all virtual objects), these interaction tasks would have been difficult and time-consuming. We removed collision detection and provided snapping upon release of a block to alleviate these handicaps.
When we were developing the different conditions, we started with a basic VE renderer that allowed the user to walk around a scene. We wanted to augment the scene with the block manipulation task, which included simple models of the enclosure, target pattern, and in the PVE case virtual blocks and user avatar. The PVE condition required over three weeks of development for coding specialized tracking, interaction, shadowing, and rendering code. In contrast, the HE and VFHE conditions were developed within hours. The incorporation of real blocks and avatars did not require writing any code. The reconstruction system obviates prior modeling and incorporating additional trackers. Further, the flexibility of using real objects and the reconstruction system enabled minor changes to be made to the HE and VFHE conditions without requiring much code rework.
5.9
Conclusions
We conducted a study to evaluate the effects of interacting with real objects and of visually faithful avatars on task performance and presence in a spatial cognitive task VE. From our results, we conclude:
Interacting with real objects significantly improves task performance over interacting with virtual objects in spatial cognitive tasks, and more importantly, it brings performance measures closer to that of doing the task in real space. In addition, the way the participant performs the task in the VE using real objects is more similar to how they would do it in a real environment. Even in our simple task, we saw evidence that manipulating virtual objects sometimes caused mistraining of manipulation actions and participants to develop VE specific approaches to the task.
Training and simulation VEs are specifically trying to recreate real experiences, and would benefit substantially from having the participant manipulate as many real objects as possible. The motion constraints and tactile feedback of the real objects provide additional stimuli that create an experience much closer to the actual task than one with purely virtual objects. Even if a real-object reconstruction system is not employed, we believe that instrumenting, modeling and tracking real objects that the participant will interact with, would significantly enhance cognitive tasks.
Motion fidelity is more important than visual fidelity for self-avatar believability. We hypothesize that motion fidelity is the primary component of self-avatar believability. We believe that a visually faithful avatar is better than a generic avatar, but from a sense-of-presence standpoint, the advantages do not seem very strong.
Designers should focus their efforts first to focus on tracking then on rendering the user avatar model for immersive VEs. If an real-object reconstruction system is not employed, we believe that texture mapping the self-avatar model with captured images of the user would provide high quality motion and visual fidelity and result in a substantial immersion benefit.
6. NASA Case Study
Motivation. In order to evaluate the potential utility of this technology in a real world task, we applied our reconstruction system to an assembly verification task. Given virtual models of complex multipart devices such as satellites and engines, designers want to determine if assembling the device is physically possible. Answering this question involves managing parts, various tools, and people with a large variance in shape. Experimenting with different designs, tools, and parts using purely virtual objects requires either generating or acquiring virtual models for all the objects in the environment, and tracking those that are moved. We believe that this additional work impedes the use of VEs to evaluate multiple designs quickly and interactively. Further our user study results suggest that the lack of haptic feedback lowers the overall VE effectiveness for such hands-on tasks as those found in assembly planning and verification.
Using a hybrid VE, one that combines real and virtual objects, allows the participant to interact with the virtual model using real tools and critical parts with his own hands. We believe this would benefit assembly verification tasks.
6.1 NASA Collaboration
We have begun a collaboration with the
Driving Problems. NASA LaRC payload designers are interested in examining models of payloads and payload subsystems for two major tasks, assembly verification and assembly training.
NASA LaRC payload designers want to discern possible assembly, integration, and testing problems early in the project development cycle. Currently, different subsystems are separately subcontracted out. The integration of the many different subsystems always generates compatibility and layout issues. Even with the greatest care in the specification of subsystem design, integration problems always occur.
Currently, it is difficult to evaluate the interaction of the different subpayloads, as the complexity and nuances of each component are understood well only by the group that developed that subsection. For example, attaching external cables is a common final integration task. With each payload being developed separately, the NASA LaRC designers described several occasions when they encountered spacing problems during the final cable attachment step. The payloads had conformed to specifications, but the reality of attaching the cables showed inadequate space for hands, tools, or parts. These layout issues resulted in schedule delays, equipment redesign, or makeshift engineering fixes.
Currently, simplified physical mock-ups are manufactured for design verification and layout, and the assembly procedure is documented in a step-by-step instruction list. The NASA LaRC payload designers recounted several occasions when the limited fidelity of mock-ups and assembly documents caused significant problems to slip through to later stages.
Given payload models, NASA LaRC payload designers want to train technicians in assembly and maintenance procedures. Much of the equipment is specific to a given payload, and training on virtual models would provide repetition and enable more people to become proficient in critical assembly stages. Also, beginning training before physical mock-ups or the actual devices are available would increase the amount of time to train. This would be useful because certain tasks, such as releasing a delicate paraffin latch properly, requires highly specific skills.
LaRC designers currently receive payload subsection CAD models from their subcontractors early in the design stage, before anything gets built. They would like to use these models to investigate assembly, layout, and integration. Changes in the early project stages are substantially cheaper in money, time, and personnel than fixes in later stages. With the critical time constraints for payload development, testing multiple design alternatives quickly would be valuable. A virtual environment potentially offers such an ability.
We believe that a hybrid VE system would enable designers to test configurations using the final assembly personnel, real tools and parts. We hypothesize that such a hybrid VE would be a more effective system for evaluating hardware designs and planning assembly than a purely virtual one.
6.2 Case Study: Payload Spacing Experiment
Overview. To evaluate the applicability of hybrid VEs to NASA LaRC assembly tasks, we designed an abstracted payload layout and assembly task for four LaRC payload designers. We presented the designers with task information in approximately the same manner as they receive it in actual design evaluation. They discussed approaches to the task and then executed the assembly procedure in the hybrid VE. We interviewed the designers to gather their opinions on how useful the system would be for tasks they currently have in payload assembly, testing, and integration.
Our first step to understand the issues involved in payload
assembly was to visit the NASA LaRC facilities and meet with engineers and
technicians. They showed us the
different stages of developing a payload, and outlined the issues they
regularly face. Specifically, we were
shown a weather imaging satellite, the CALIPSO project, and a light imager unit
on the satellite called the photon multiplier tube (PMT).
|
Figure 34 – Photon Multiplier Tube (PMT) box for the CALIPSO satellite payload. We used this payload subsystem as the basis for our case study.
Courtesy of NASA LaRC's CALIPSO project. |
Figure 35 – VRML model of the PMT box.
|
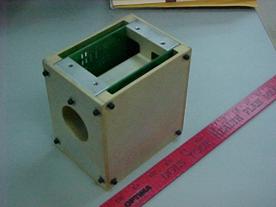

shows an engineering mock-up of the real PMT, without the imager tube that fits in the center cylindrical channel.
|
Figure 34 – Photon Multiplier Tube (PMT) box for the CALIPSO satellite payload. We used this payload subsystem as the basis for our case study.
Courtesy of NASA LaRC's CALIPSO project. |
Figure 35 – VRML model of the PMT box.
|
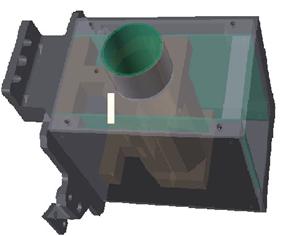
We received CAD models of the PMT, and abstracted a task that was similar to many of the common assembly steps, such as attaching components and fastening cable connectors.
Assembly Task Description. The PMT model, along with two other payloads (payload A and payload B), was rendered in the VE. The system performed collision detection among the virtual payloads and the real-object avatars. The system indicated collisions by rendering in red the virtual object in collision as shown in Figure 36.
|
Figure 36 – Collisions between real objects (pipe and hand) and virtual objects (payload models) cause the virtual objects to flash red.
|
Figure 37 – Parts used in the shield fitting experiment. PVC pipe prop, power cord, tongs (tool), and the outlet and pipe connector that was registered with the virtual model.
|
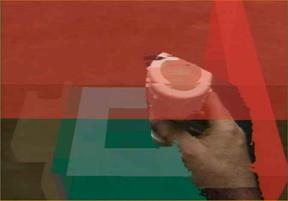
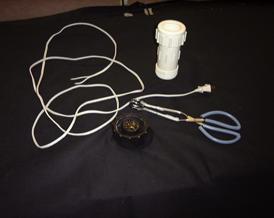
The task was to use real objects (Figure 33) and interact with the PMT model and screw a cylindrical shield (mocked-up as a PVC pipe) (Figure 40, Figure 41) into a pipe receptacle and then plug a power connector into an outlet inside the shield (Figure 42, Figure 43). If the participant required additional assistance, we provided tools to aid in the task (Figure 44, Figure 45). A diagram of the task is shown in Figure 39.
The designers were to determine how much space was required between the top of the PMT box and the bottom of payload A as shown in Figure 38.
|
Figure 38 – The objective of the task was to determine how much space between the PMT and the payload above it (red arrow) is required to perform the shield and cable fitting task.
|
Figure 39 – Cross-section diagram of task. The pipe (red) and power cable (blue) need to be plugged into the corresponding connector down the center shaft of the virtual PMT box.
|
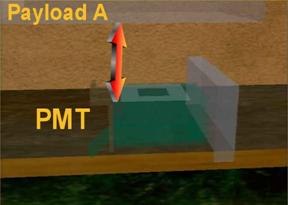
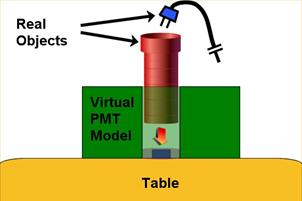
|
Figure 40 – The first step was to slide the pipe between the payloads and then screw it into the fixture.
|
Figure 41 – 3rd person view of this step.
|
|
Figure 42 – After the pipe was in place, the next step was to fish the power cable down the pipe and plug it into the outlet on the table.
|
Figure 43 – 3rd person view of this step. Notice how the participants holds his hand very horizontally to avoid colliding with the virtual PMT box.
|
|
Figure 44 – The insertion of the cable into the outlet was difficult without a tool. Tongs were provided to assist in the plugging in the cable.
|
Figure 45 – 3rd person view of this step.
|
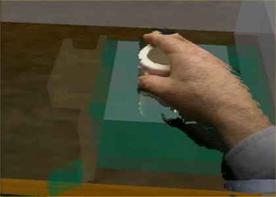
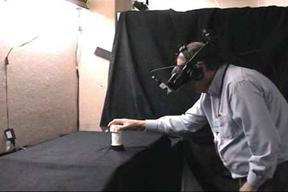
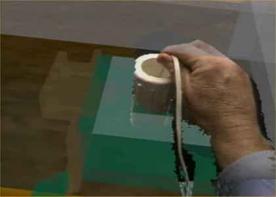
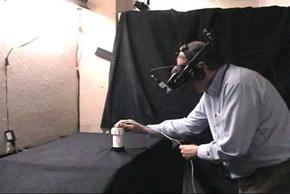
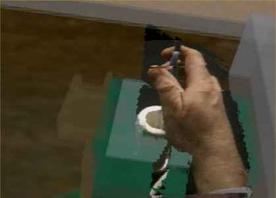
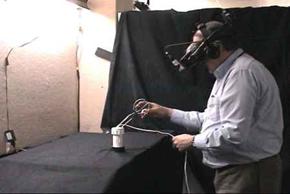
Experimental Procedure. On
· How much space between the PMT and payload A is necessary to perform the pipe insertion and power cable attachment procedures?
· How much space between the PMT and payload A would you actually allocate (given typical payload layout space constraints) for the pipe insertion and power cable attachment procedures?
After completing the survey, each participant performed the pipe insertion and power cable attachment procedure in the reconstruction system.
· First, participants donned the HMD and walked around the VE to get used to it.
· Next, they tested the collision detection system by moving their hands into intersection with the PMT box and then with payload A to see the visual results (rendered in red) of collisions with virtual objects.
· Then, they picked up the pipe and eased it into the center cylindrical assembly while trying to avoid colliding with either payload A or the PMT box.
· After the pipe was lowered into the cylindrical shaft of the PMT, they snaked the power cord down the tube and inserted it into the outlet.
The experimenter could dynamically adjust the space between the PMT and payload A. As the participant asked for more or less space, the experimenter adjusted the height of payload A (moving it up and down). With this interaction, different spatial configurations of the two payload subassemblies could be quickly evaluated.
The post-experience survey focused on the participant’s reaction to the actual space required between the PMT and payload A, as interactively determined while they were in the VE. This survey is summarized in Table 11 and attached as Appendix C.2. The responses of all participants are attached as Appendix C.3.
Results. Given that the pipe was 14 cm and had a 4 cm diameter:
Table 11 – LaRC participant responses and task results
|
Participant # |
||||
|
|
#1 |
#2 |
#3 |
#4 |
|
(Pre-experience) How much space is necessary between Payload A and the PMT? |
14 cm |
14.2 cm |
15 - 16 cm |
15 cm |
|
(Pre-experience) How much space would you actually allocate? |
21 cm |
16 cm |
20 cm |
15 cm |
|
Actual space required (determined in VE) |
15 cm |
22.5 cm |
22.3 cm |
23 cm |
|
(Post-experience) How much space would you actually allocate after your VE experience? |
18 cm |
16 cm (modify tool) |
25 cm |
23 cm |
Space is scarce and the engineers were stingy with it. This was especially true for participants #2 and 4 who had experience with actual payload assembly. Participant #3 was a flight software engineer and had less experience with actual installing payload hardware.
Each participant was able to complete the task. Participant #1 was able to complete the task without using a special tool, as the power cable was stiff enough to force into the outlet. Since an aim was to impress upon the participants the possibility of requiring unforeseen tools in assembly or repair, we used a more flexible cable for the remaining participants. While trying to insert the power cable, participants #2, 3, and 4 noted they could not complete the task. When asked what they required, they all remarked they wanted a tool to assist in plugging in the cable. They were handed a tool (set of tongs) and were then able to complete the power cable insertion task as shown in Figure 45. Using the tool required to increasing the spacing between the PMT and Payload A so as to avoid collisions. Interactively changing the spacing allowed testing new spacing design layouts while in the VE. The use of the tool increased the required spacing between the PMT box and payload A from 14 cm to an average 24 cm.
The more flexible power cable could not be snaked down the pipe and inserted into the outlet without some device to help push the connector when it was inside the pipe. This was because the pipe was too narrow for the participant’s hands. Connecting the power cable before attaching the pipe still has the same spacing issues. The virtual PMT box still hinders the attachment of the power cable, regardless of whether or not the pipe has been inserted (Figure 39).
Whereas in retrospect it was obvious that the task would not be easily completed without an additional tool, not one of the designers anticipated this requirement. We believe the medium by which the assembly information was provided (diagrams, task descriptions, and assembly drawings), made it difficult for designers, even though each had substantial payload development experience, to catch subtle assembly integration issues. On average, the participants allocated 5.6 cm too little space between the payloads on their pre-experience surveys.
The hybrid VE system provided readily identifiable benefits over purely virtual approaches for conducting the assembly verification task quickly and effectively:
· The participants saw themselves, tools, and critical parts within the environment.
· The interaction with the VE was very natural, and participants needed no instruction. After having it explained that virtual parts would change color when in collision, participants began carrying out the task almost immediately after putting on the HMD.
· Participants quickly adapted hand positions to avoid collisions with the virtual payload models (See Figure 43).
· The system could accommodate incorporating various tools extemporaneously, without either prior modeling or any additional development. Different layouts, task approaches, and tools could be evaluated quickly.
· The motion constraints of the pipe threads and the power cable socket aided in interacting with these objects. Purely virtual approaches would be hard-pressed to provide comparable interactions.
Physical mock-ups are more costly to build than virtual models, require substantial time to create, and have varying degrees of fidelity with a final payload. These characteristics reduce their use early in the design evaluation stage. The NASA LaRC personnel recounted a scenario in which even the high-quality replications used in later development stages had simplifications that hurt the final integration. “Connector savers”, cable connectors replications used to reduce the wear on the actual connectors, did not contain a small bolt that was in the designs, and on the actual connector. When the final cable was to be attached, the bolt did not allow a proper fit of the cable into the connector. The NASA engineers recounted that they had to force the cable down, turn the cable so at least a few threads were holding it connected, and hope that the launch vibration would not unseat the cable and ruin years of work.
Compared to physical mock-ups, hybrid VEs can provide a cheaper and quicker alternative system for evaluating designs and layouts, especially in the early phases. Further, as illustrated in the above example, there are occasions when using full CAD models provides a distinct advantage for evaluation tasks over physical mock-ups, which will contain simplifications.
Debriefing. The three participants who required the tool to complete the task were extremely surprised that a tool was needed and that so much additional space was required to accommodate the tool. When they discovered the required spacing was much more than the amount they allocated, they immediately commented on the potential time and schedule savings of evaluating designs at the model stage.
The post-experience survey asked the participants to quantify the time and financial savings that early identification of the spacing error would provide.
|
Participant # |
||||
|
|
#1 |
#2 |
#3 |
#4 |
|
Time cost of the spacing error |
days to months |
30 days |
days to months |
months |
|
Financial cost of the spacing error |
$100,000s - $1,000,000+ |
largest cost is huge hit in schedule |
$100,000s - $1,000,000+ |
$100,000s |
All participants responded that the financial implications could be anywhere from moderate (hundreds of thousands of dollars), such as keeping personnel waiting till a design fix was implemented, to extreme (millions of dollars), such as causing launch delays. In every payload design, time is the most precious commodity, and critical-path delays could even result in missing a launch date. Every participant mentioned that identifying problems such as the spacing error would provide the largest benefit in reducing schedule delays.
Participants exhibited interesting interaction methods with the virtual model. The virtual model was not very detailed, and the visual contrast between real and virtual objects was rather obvious. Yet, participants made concerted efforts to avoid touching the virtual model. Upon being told about his effort to avoid touching the purely virtual PMT box, a participant said, “that was flight hardware… you don’t touch flight hardware.” The familiarity and relevancy of the task made the experience vivid for the participants. Participants commented that their actions in the VE were very similar to how they would actually approach the task.
After completing the task, participants remarked that VEs and object reconstruction VEs would be useful for the following payload development tasks:
· Assembly training.
· Hardware layout (including cable routing and clearance testing).
· Evaluating designs for equipment integration and fitting.
· Evaluating designs for environmental testing - e.g., how to arrange a payload inside a thermal-vacuum chamber.
Lessons Learned. The NASA LaRC payload designers and engineers were very optimistic about applying traditional VEs, object reconstruction VEs, and simulations to aid in payload development. They are interested in looking at virtual models to evaluate current payload integration tasks and upcoming payload designs.
There are substantial gains to be realized by using virtual models in almost every stage of payload development. But, using virtual models has the most significant benefit in the design stage. Further, early identification of assembly, integration, or design issues would result in considerable savings in terms of time, money, and man-hours. Many of their tasks involve technicians interacting with a payload with tools and parts. These tasks are well suited to be simulated within an object reconstruction VE.
7. Conclusions
We have developed a system for incorporating dynamic real objects into a virtual environment. This involved developing algorithms for generating virtual representations of real objects in real time and algorithms for collision detection and response between these virtual representations and other virtual objects.
7.1 Recap results
Real-Time Object Reconstruction Algorithms. We have presented an algorithm that exploits graphics hardware to generate a real-time view-dependent sampling of real objects’ visual hull from multiple camera views. The resulting reconstructions are used to generate visually faithful avatars and as active objects in immersive VEs. The system does not require additional trackers or require a priori object information, and allows for natural interaction between these objects and the rest of the virtual environment.
Real – Virtual Object Interaction Algorithms. We further extended the real-time image-based object reconstruction system to detect collisions between real and virtual objects and to respond appropriately. This required new algorithms for colliding polygonal virtual models with the dynamic real-object avatars.
User Studies on Real Objects in VEs. We then conducted studies to evaluate the advantages that manipulating real objects could provide over purely virtual objects in cognitive manual tasks.
The results suggest that manipulating and interacting with real objects in a VE provide a significant task performance improvement over interacting with virtual objects. We believe this is because the objects’ interaction affordances are complete and proper and because the participant has haptic feedback.
We suggest those developing VEs that simulate, train users on, or require a spatial cognitive component, consider enabling the participant to interact with real objects, as their performance will more closely match their real world task performance.
The results did not show a significant difference in participant reported sense-of-presence for those represented by a visually faithful personalized self-avatar over those represented by generic self-avatars. We have concluded that the principal attribute of avatars for presence is kinetic fidelity. Visual fidelity is important, yet apparently less so. We hypothesize that for participants, visual fidelity encompasses kinetic fidelity. If they see a highly accurate avatar, they expect it to move realistically as well.
We feel with further studies and a more developed presence questionnaire could identify the effects of visually faithful avatars. Those represented by the visually faithful self-avatars showed a preference for the personalization. To what extent and how much of a benefit this provides were not answered in our study.
Applying the system. We believe that many assembly verification tasks could be assisted through interacting with real objects in a VE. Our work with NASA LaRC has shown that the system could provide a substantial benefit in hardware layout and assembly verification tasks. The reconstruction system enables complex interactions with virtual models to be performed with real tools and parts. This would allow for more time and training for personnel on delicate and complex operations. Further, designers could evaluate payload development issues dealing with assembly verification, layout, and integration.
7.2 Future Work
This current implementation is a prototype that enables us to do basic research on interaction VE issues. The future work focuses on increasing performance, improving results, and examining other VE interaction research directions.
Reconstruction Algorithm. Future work to the reconstruction algorithm includes porting the system to a networked cluster of PCs, speed and calibration improvements, and correlating visual hulls to real objects.
Currently the system runs on a SGI Reality Monster graphics
supercomputer. The high cost, limited
number in service, and infrequent upgrades makes it an inadequate solution to
make the system widely usable. If the
object is to get the system into widespread use, then the primary factor is
cost. The mass-market forces that drive
commodity hardware has led to low prices and frequent upgrades. The tremendous advances in consumer-grade
computers, networking, and graphics cards have made a networked PC-based system
an attractive, continually evolving solution.
Current image-based scene reconstruction algorithms are starting to make
use of networked PCs, such as the Virtualized Reality [Baba00], 3-D
Tele-Immersion [Raskar98] and Image-Based Visual
A typical hardware setup is as follows. A dedicated network of PCs, each connected via high bandwidth (i.e. Firewire) to high quality cameras, capture the scene. Each PC has enough computation power to perform any image processing steps. Next, the resulting images are sent, possibly with compression, to a central PC that will do the reconstruction.
For our algorithms, the newer high bandwidth PC buses from the system memory to texture memory (such as AGP 4x and AGP 8x) provide the necessary throughput for uploading the images into graphics card memory in real time for processing. The graphics requirements of the algorithm are not very high, and current systems could provide interactive performance.
Porting the algorithm to PCs would allow us to benefit from the performance and feature gains from the constantly advancing game-graphics hardware. With new generations of graphics cards that improve performance and provide new functions, such as pixel shaders, the reconstruction algorithm would be able to provide results more rapidly and with more resolution.
To improve the speed of the reconstruction algorithm, we look at methods to reduce the fill rate (the number of pixels being scan converted) of the algorithm. One optimization would be to compute bounding boxes for object pixel clusters in the object-pixel maps. This would allow for trivial accept/rejects during plane sweeping. Since fill rate is the current reconstruction bottleneck, reducing it will result in the faster results.
To improve the accuracy of the system, future work needs to be done on the input into the reconstruction algorithms. The results of image segmentation are sensitive to shadows and high frequency areas of the scene. Further, using segmentation thresholds and background images are imprecise methods for image segmentation. The consequences of these image segmentation errors are increased visual hull size for incorrectly labeled object pixels, and holes in the visual hull for incorrectly labeled background pixels. Applying image processing algorithms on the input camera images and using a more rigorous camera calibration algorithm would improve the accuracy and decrease the noise in the reconstructions.
Identifying the visual hull with the corresponding real object would be useful for improving collision response and tracking of the real objects. By determining information on what real object the virtual object collided with, the system could respond in specific ways to specific objects. Tracking real objects could also enable a high fidelity virtual model to collide with virtual models and render to the user in place of the real object avatar.
Real – Virtual Object Interaction. The collision detection and response algorithms provided plausible responses for a basic physics simulation. Higher fidelity responses requirements could require new algorithms for finding important data.
Our current algorithm has many opportunities for performance improvement. We foresee strong improvement in performance through more efficient use of texture and OpenGL state changes. These types of changes should be done across the entire buffer, instead of on a per primitive basis. This amortizes the cost of state changes, as they are more expensive than triangle setup and rendering.
Collision detection accuracy could be improved through better use of framebuffer resolution and improved camera calibration. The resolution of collision detection is dependent on the size of the viewport the primitive is rendered into during volume-querying. Thus using viewports whose size is dependent on the primitive being rendered would allow the setting of a minimum spatial resolution for detecting collisions. Along with improving reconstruction accuracy, more accurate camera calibration techniques would also improve collision detection accuracy.
Collision response could be improved by finding better algorithms for determining penetration depth, surface normals, and collision points. The results of the current algorithm are only estimates. Volume-querying with different primitives during collision response could allow for better algorithms for finding more accurate results for collision resolution information.
The present limitation in our responding to collisions follows from the inability to backtrack the motions of real objects. Keeping previous camera images, along with tracking real objects within the camera images, would enable backtracking. By looking at the shape and motion of a tracked object across several frames, information, such as object velocity, acceleration, rotation, and center of mass, could be derived. This information would provide simulations with additional information for more accurate collision response.
Interactions in VEs. Through expanding the interactions between real objects and the synthetic environment, we seek to enable a new type of hybrid reality. Where this is applicable can be initially difficult to identify. The ability to incorporate real objects removes some of the interaction limitations that have made VEs ineffective for certain applications.
There is much future work in identifying applications beyond assembly verification tasks that could benefit from incorporating real objects into VEs. We hypothesize the following VE applications would benefit from incorporating dynamic real objects:
· Training – Handling real tools and parts while interacting with virtual objects would allow training VEs to simulate actual conditions more accurately.
· Telepresence – Rendering novel views of real participants and objects within a virtual scene to other participants could improve the interpersonal communication effectiveness.
· Phobia Treatment – Incorporating a real object of the phobia being treated would increase the effectiveness of the VE. The visual and tactile feedback of a real object, for example the subject of the phobia, interacting with virtual objects would improve the realism of the VE. Hoffman used a tracked furry toy spider for arachnophobia treatment with startling results on the effectiveness of including real objects that were registered with virtual objects [Hoffman97].
User Study. The third and possibly most interesting area of future research is the ability to study avatars and interaction in immersive VEs.
Do visually faithful avatars affect presence in virtual environments? We believe they do. Yet even if this is true, how strong an effect do they have? Even though our user study does not show a significant difference in presence, the user interviews leads us to believe there is some effect. Future work would involve identifying tasks and questionnaires that can isolate the effect of avatar visual fidelity on presence in VEs.
The block design task we used might be too cognitively engrossing for questionnaires on the experience to focus on presence. Some participants who commented they felt a low level of immersion still believed completely they were within the VE environment during the task. More specific questions or behavioral measures that focus on avatars and presence would help distinguish the effects of appearance fidelity from kinetic fidelity.
Which aspects of an avatar are important for presence? Knowing this would help designers of VEs evaluate what the appropriate level of effort they should expend on avatars to have a desired effect. Is kinesthetic fidelity the only important factor? How large a role does visual fidelity, haptic feedback, and the naturalness of the interaction play?
How much does handling real objects in a VE benefit training? In our user study’s PVE condition, we saw participants learning physically incorrect mnemonics due to the mis-registration between the real and virtual avatars. Can we identify the training tasks that would most benefit from having the user handle real objects?
Do the greater affordance matches of interacting with real objects expand the application base of VEs? We know that the purely virtual nature of current VEs has limited the applicability of VE to some tasks. Which ones would benefit now that VEs can incorporate real objects?
8. Bibliography
[Abdel-Aziz71] Y. Abdel-Aziz
and H. Karara, Direct Linear Transformation from Comparator Coordinates Into
Object Space Coordinates in Close-Range Photogrammetry. Proceedings of the Symposium on
Close-Range Photogrammetry.
[Arthur00] K. Arthur,
“Effects of Field of View on Performance with Head-Mounted Displays”. Department of Computer Science, UNC-Chapel
Hill, 2001, Unpublished dissertation.
[Baba00] S. Baba, H.
Saito, S. Vedula, K.M. Cheung, and T. Kanade. Apperance-Based Virtual-View
Generation for Fly Through in a Real Dynamic Scene. In VisSym ’00 (Joint Eeurographics – IEEE
TCVG Symposium on Visualization), May, 2000.
[Baciu99] G. Baciu, W.
Wong and H. Sun, “RECODE: An Image-based Collision Detection Algorithm”, Journal
of Visualization and Computer Animation, Vol. 10, No. 4, 1999 pp. 181-192.
[Badler99] N. Badler, R.
Bindiganavale, J. Bourne, J. Allbeck, J. Shi, and M. Palmer. Real Time Virtual Humans. Proceedings of
International Conference on Digital Media Futures British Computer
Society, Bradford, UK, April, 1999.
[Banerjee99] A. Banerjee,
P. Banerjee, N. Ye, and F. Dech. Assembly Planning Effectiveness using Virtual
Reality. Presence, 8(7):204--217, 1999.
[Bouguet98] J. Bouguet.
Camera Calibration from Points and Lines in Dual-Space Geometry. Technical Report, California Institute of
Technology. [XXX]
[Bowman97] D. Bowman and
L. Hodges. An Evaluation of Techniques for Grabbing and Manipulating Remote
Objects in Immersive Virtual Environments, 1997 Symposium on Interactive 3-D
Graphics, pp. 35-38 (April 1997). ACM
SIGGRAPH. Edited by Michael Cohen and David Zeltzer. ISBN 0-89791-884-3.
[Boyles00]. M. Boyles and
S. Fang. “Slicing-Based Volumetric Collision Detection”, ACM Journal of
Graphics Tools, 4(4): 23-32, 2000.
[Breen95] D. Breen, E.
Rose, R. Whitaker, Interactive Occlusion and Collision of Real and Virtual
Objects in Augmented Reality, 1995.
[Brooks99] F. Brooks Jr.,
1999: "What's Real
About Virtual Reality?" IEEE Computer Graphics and Applications,19,
6:16-27.
[Bush99] T. Bush, (1999) Gender Differences in Cognitive Functioning: A Literature Review. The Cyber-Journal of Sport Marketing, Vol. 1.
[Butcher00] J. Butcher,
C. Bass, and L. Danisch. Evaluation of Fiber-Optic Sensing Band For the
Characterization of Deformation Contours. Southern Biomedical Engineering
Conference 2000.
[Carr98] J. Carr, W.
Fright, A. Gee, R. Prager and K. Dalton. 3-D Shape Reconstruction using Volume
Intersection Techniques. In IEEE
International. Conference on Computer Vision Proceedings, 1095-1110,
January 1998.
[Chien86] C. Chien and J.
Aggarwal. Volume/Surface Octrees for the Representation of Three-Dimensional
Objects. Computer Vision, Graphics, and
Image Processing, volume 36, No. 1, 100-113, October 1986.
[Daniilidis00] K.
Daniilidis, J. Mulligan, R. McKendall, G. Kamberova, D. Schmid, R. Bajcsy. Real-Time 3-D Tele-immersion. In The Confluence of Vision and Graphics,
A Leonardis et al. (Ed.), Kluwer Academic Publishers, 2000.
[Edelsbrunner92] H.
Edelsbrunner and E. Mucke. Three-Dimensional Alpha Shapes. 1992 Workshop on
Volume Visualization. pp. 75-82, 1992.
[Ehmann00] S. Ehmann and
M. Lin, Accurate Proximity Queries Between Convex Polyhedra By Multi-Level Voronoi
Marching. Proceedings of the
International Conference on Intelligent Robots and Systems, 2000.
[Faugeras93a] O.
Faugeras, Three Dimensional Computer Vision, The MIT Press, 1993.
[Faugeras93b] O.
Faugeras, T. Vieville, E. Theron, J. Vuillemin, B. Hotz, Z. Zhang, L. Moll, P.
Bertin, H. Mathieu, P. Fua, G. Berry, and C. Proy. Real-time Correlation-Based Stereo:
Algorithm, Implementations and Applications.
INRIA Technical Report RR-2013.
[Garau01] M. Garau, M.
Slater, S. Bee, and M.A. Sasse. The Impact of Eye Gaze on Communication Using
Humanoid Avatars. Proceedings of the
SIG-CHI Conference on Human Factors in Computing Systems, March 31- April 5,
2001, Seattle, WA USA, pages 309-316.
[Hand97] C. Hand. A Survey of 3-D Interaction Techniques, Computer Graphics Forum, 16(5), pp. 269-281 (1997). Blackwell Publishers. ISSN 1067-7055.
[Heeter92] C. Heeter, Being There: The Subjective Experience of Presence, PRESENCE, Teleoperations and Virtual Environments, Volume 1, Number 2, pp 262-271.
[Hilton00] A. Hilton, D. Beresford, T. Gentils, R. Smith, W. Sun, and J/ Illingworth. Whole-Body Modelling of People from Multiview Images to Populate Virtual Worlds, The Visual Computer, 16 (7), pp. 411-436 (2000). ISSN 0178-2789.
[Hinckley94] K. Hinckley,
R. Pausch, J. Goble, and N. Kassell, Passive Real-World Interface Props for
Neurosurgical Visualizatoin. CHI94, pp 452-458.
[Hoffman97] H. Hoffman,
A. Carlin, and S. Weghorst, Virtual Reality and Tactile Augmentation in the
Treatment of Spider Phobia. Medicine
Meets Virtual Reality 5, San Deigo, California.
Jan. 1997.
[Hoffman98] H. Hoffman, Physically Touching Virtual Objects Using Tactile Augmentation Enhances the Realism of Virtual Environments. Proceedings of the IEEE Virtual Reality Annual International Symposium '98, Atlanta GA, p. 59-63. IEEE Computer Society, Los Alamitos, California.
[Hoff01] K. Hoff, A. Zaferakis, M. Lin, and D. Manocha, Fast and Simple 2-D Geometric Proximity Queries Using Graphics Hardware, 2001 ACM Symposium on Interactive 3-D Graphics. pp. 145-148, 2001.
[Hollnagel02] E. Hollnagel, (2002) Handbook of Cognitive
Task Design. To be published by Lawrence
Erlbaum Associates, Inc.
[Insko01] B. Insko,
Passive Haptics Significantly Enhances Virtual Environments, Department of
Computer Science, UNC-Chapel Hill, 2001, Unpublished dissertation.
[Levoy00] M. Levoy, K.
Pulli, B. Curless, S. Rusinkiewicz, D. Koller, L. Pereira, M. Ginzton, S.
Anderson, J. Davis, J. Ginsberg, J. Shade, and D. Fulk. “The Digital
Michelangelo Project: 3-D Scanning of Large Statues.” Proceedings of ACM
SIGGRAPH 2000. pp. 131-144, 2000.
[Lindeman99] R. Lindeman,
J. Sibert, and J. Hahn. “Hand-Held Windows: Towards Effective 2D Interaction in
Immersive Virtual Environments.” In IEEE
Virtual Reality, 1999.
[Kakadaris98] I. Kakadiaris
and D Metaxas. Three-Dimensional Human Body Model Acquisition from Multiple
Views. Int’l Journal of Computer Vision
30, 1998.
[Kutulakos00] K.
Kutulakos. Approximate N-View Stereo. Proceedings,
6th European Conference on Computer Vision, Dubin, Ireland, pp.
67-83, 2000.
[Laurentini4] A.
Laurentini. The Visual Hull Concept for Silhouette-Based Image Understanding. IEEE Transactions on Pattern Analysis and
Machine Intelligence, Vol 16, No. 2, 150-162, February 1994.
[Lin98]
M. Lin, S. Gottschalk, Collision Detection between Geometric Models: A
Survey. Proc. IMA Conference on
Mathematics of Surfaces 1998.
[Lok01] B. Lok. Online Model Reconstruction for Interactive
Virtual Environments,” Proceedings 2001 Symposium on Interactive 3-D Graphics,
Chapel Hill, N.C., 18-21. March 2001, 69-72, 248.
[Maringelli01] F.
Maringelli, J. McCarthy, A. Steed, M. Slater and C. Umiltà. Shifting
Visuo-Spatial Attention in a Virtual Three-Dimensional Space, Cognitive Brain
Research Volume 10, Issue 3, January 2001, 317-322.
[Matusik00] W. Matusik,
C. Buehler, R. Raskar, S. Gortler and L. McMillan. Image-Based Visual Hulls. In
SIGGRAPH 00 Proceedings, Annual Conference Series, pages 369-374.
[Matusik01] W. Matusik,
C. Buehler, and L. McMillan, "Polyhedral Visual Hulls for Real-Time
Rendering", Eurographics Workshop on Rendering 2001.
[Meehan01] M. Meehan,
Physiological Reaction as an Objective Measure of Presence in Virtual
Environments, Department of Computer Science, UNC-Chapel Hill, 2001,
Unpublished dissertation.
[Moezzi96] S. Moezzi,
Katkere, A., Kuramura, D. Y., & Jain, R. Reality Modeling and Visualization
from Multiple Video Sequences. IEEE
Computer Graphics and Applications, 16(6), 58-63, 1996.
[Mortensen02] J.
Mortensen, V. Vinayagamoorthy, M. Slater, A. Steed, B. Lok, and M.
Whitton, “Collaboration in
Tele-Immersive Environments”, Eighth Eurographics Workshop on Virtual
Environments (EGVE 2002) on May 30-31, 2002.
[Niem97] W. Niem.
"Error Analysis for Silhouette-Based 3D Shape Estimation from Multiple
Views", Proceedings on International Workshop on Synthetic - Natural
Hybrid Coding and Three Dimensional Imaging (IWSNHC3DI'97), Rhodos, 6-9
September 1997.
[Pabst02] T. Pabst and L.
Weinand, “PC Graphics Beyond XBOX – nVidia Inroduces GeForce4”, Retrieved March
28, 2002 http://www6.tomshardware.com/graphic/02q1/020206/index.html.
[Pertaub01] D-P. Pertaub,
M. Slater, and C Barker, “An Experiment on Fear of Public Speaking in Virtual Reality,”
Medicine Meets Virtual Reality 2001, pp. 372-378, J. D. Westwood et al.
(Eds) IOS Press, ISSN 0926-9630.
[Potmesil87] M. Potmesil,
Generating Octree Models of 3-D Objects from Their Silhouettes in a Sequence of
Images. Computer Vision, Graphics and
Image Processing. Vol 40, 1-29,
1987.
[Raskar98] Raskar, R., Welch, G., Cutts, M., Lake, A., Stesin, L., and Fuchs, H. “The Office of the Future: A Unified Approach to Image-Based Modelling and Spatially Immersive Displays,” Computer Graphics. M. F. Cohen. Orlando, FL, USA (July 19 - 24), ACM Press, Addison-Wesley: 179-188.
[Razzaque01] Razzaque, S. Z. Kohn, M. Whitton "Redirected Walking," Proceedings of Eurographics 2001, September 2001.
[Rehg94] J. Rehg and T.
Kanade. Digiteyes: Vision-based hand tracking for human-computer interaction.
In J. Aggarwal and T. Huang, editors, Proceedings
of Workshop on Motion of Non-Rigid and Articulated Objects, pages 16-22,
IEEE Computer Society Press. November 1994.
[Satalich95] G. Satalich,
“Navigation and Wayfinding in Virtual Reality: Finding Proper Tools and Cues to
Enhance Navigation Awareness”, Masters Thesis, University of Washington.
[Seitz97] S. Seitz and C.
Dyer, Photorealistic Scene Reconstruction by Voxel Coloring, Proceedings of
the Computer Vision and Pattern Recognition Conference, 1997, 1067-1073.
[Simone99] L. Simone. Poser 4 (Review).
Retrieved March 26, 2002.
http://www.zdnet.com/products/stories/reviews/0,4161,2313739,00.html
[Slater93] M. Slater and
M. Usoh. The Influence of a Virtual Body
on Presence in Immersive Virtual Environments, VR 93, Virtual Reality
International, Proceedings of the Third Annual Conference on Virtual Reality,
London, Meckler, 1993, pp34-42.
[Slater94] M. Slater and
M. Usoh. Body Centred Interaction in Immersive Virtual Environments, in N.
Magnenat Thalmann and D. Thalmann, editors, Artificial
Life and Virtual Reality, pages 125-148, John Wiley and Sons, 1994.
[Sutherland65] I.
Sutherland. “The Ultimate Display,” Proceedings of IFIP 65, Vol 2, pp 506,
1965.
[Thalmann98] D. Thalmann.
The Role of Virtual Humans in Virtual Environment Technology and Interfaces,
Proceedings of Joint EC-NSF Advanced Research Workshop, Bonas, France, 1998.
[Turk94] G. Turk and M.
Levoy. Zippered Polygon Meshes From
Range Images. Proceedings of ACM
SIGGRAPH 1994. pp. 311-318, 1994.
[Usoh99] M. Usoh, K.
Arthur, et al. Walking > Virtual Walking> F lying, in Virtual
Environments. Proceedings of SIGGRAPH 99,
pages 359-364, Computer Graphics Annual Conference Series, 1999.
[Usoh00] M. Usoh, E. Catena, S. Arman, and M. Slater, Using Presence Questionnaires in Reality, Presence: Teleoperators and Virtual Environments, 9(5) 497-503.
[Ward01] M. Ward (2001). EDS Launches New Tool To Help Unigraphics CAD/CAM Software Users With Earlier Detection Of Product Design Problems. Retreived March 26, 2002. http://www.apastyle.org/elecgeneral.html.
[Wechsler39] Wechsler, D. The Measurement of Adult Intelligence, 1st Ed., Baltimore, MD: Waverly Press, Inc.
[Welch96] R. Welch, T.
Blackmon, A. Liu, A. Mellers, and L. Stark. “The Effect of Pictorial Realism,
Delay of Visual Feedback, and Observer Interactivity on the Subjective Sense-of-presence in a Virtual
Environment.” Presence: Teleoperators and Virtual Environments, 5(3):263-273.
[Zachmann01] G. Zachmann
and A. Rettig. Natural and Robust Interaction in Virtual Assembly
Simulation. Eighth
ISPE International Conference on Concurrent Engineering: Research and
Applications (ISPE/CE2001), July 2001, West Coast Anaheim Hotel, California,
USA.