Matrix: MaxPlanck/shallow_water2
Description: shallow water modelling, Max-Planck Inst. of Meteorology
|
| (undirected graph drawing) |
 |
| Matrix properties | |
| number of rows | 81,920 |
| number of columns | 81,920 |
| nonzeros | 327,680 |
| structural full rank? | yes |
| structural rank | 81,920 |
| # of blocks from dmperm | 1 |
| # strongly connected comp. | 1 |
| explicit zero entries | 0 |
| nonzero pattern symmetry | symmetric |
| numeric value symmetry | symmetric |
| type | real |
| structure | symmetric |
| Cholesky candidate? | yes |
| positive definite? | yes |
| author | K. Leppkes, U. Naumann |
| editor | T. Davis |
| date | 2009 |
| kind | computational fluid dynamics problem |
| 2D/3D problem? | yes |
Notes:
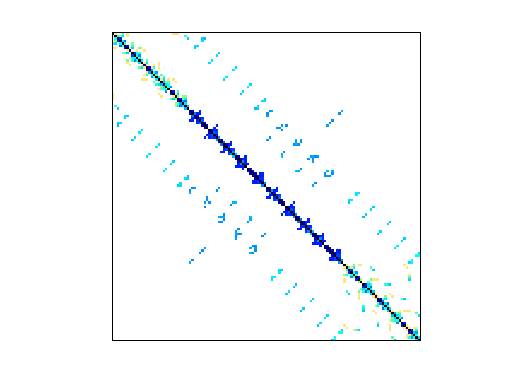
The two shallow_water* matrices arise from weather shallow water equations
(see http://www.icon.enes.org), from the Max-Plank Institute of Meteorology.
The problem gives rise to an automatic differentiation problem.  An iterative
solver is used for the larger problem, but a direct sovler is used for
finding the adjoints of a linear problem.  The velocity field is integrated
over a time loop with a semi-implicit method.  The implicit part leads to
a linear problem A*x=b, whose entries vary with time.  Two of these matrices
A are in this collection, with shallow_water1 at dtime=100 and shallow_water2
at dtime=200.  The nonzero patterns of the two matrices are the same, but
shallow_water1 is much slower.  The reason is that many denormals appear
during factorization, which greatly slows down the BLAS.  This can be solved
by compiling with gcc -ffast-math, to flush denormals to zero.
| Ordering statistics: | result |
| nnz(chol(P*(A+A'+s*I)*P')) with AMD | 2,357,535 |
| Cholesky flop count | 5.8e+08 |
| nnz(L+U), no partial pivoting, with AMD | 4,633,150 |
| nnz(V) for QR, upper bound nnz(L) for LU, with COLAMD | 5,355,578 |
| nnz(R) for QR, upper bound nnz(U) for LU, with COLAMD | 9,691,968 |
For a description of the statistics displayed above, click here.
Maintained by Tim Davis, last updated 12-Mar-2014.
Matrix pictures by cspy, a MATLAB function in the CSparse package.
Matrix graphs by Yifan Hu, AT&T Labs Visualization Group.