Matrix: Li/pli
Description: 3D Finite element matrix, magnetohydrodynamic problem with 5 variables
|
| (undirected graph drawing) |
 |
 |
| Matrix properties | |
| number of rows | 22,695 |
| number of columns | 22,695 |
| nonzeros | 1,350,309 |
| structural full rank? | yes |
| structural rank | 22,695 |
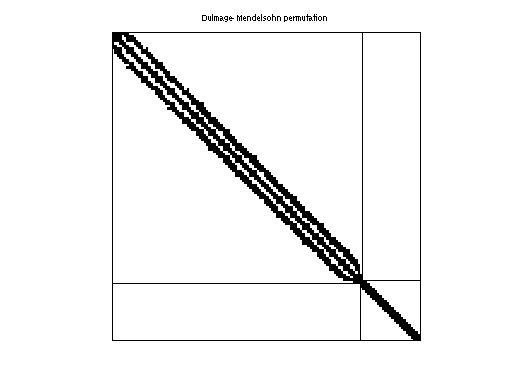
| # of blocks from dmperm | 2 |
| # strongly connected comp. | 2 |
| explicit zero entries | 0 |
| nonzero pattern symmetry | symmetric |
| numeric value symmetry | symmetric |
| type | binary |
| structure | symmetric |
| Cholesky candidate? | yes |
| positive definite? | no |
| author | B. Li |
| editor | T. Davis |
| date | 1999 |
| kind | duplicate electromagnetics problem |
| 2D/3D problem? | yes |
Notes:
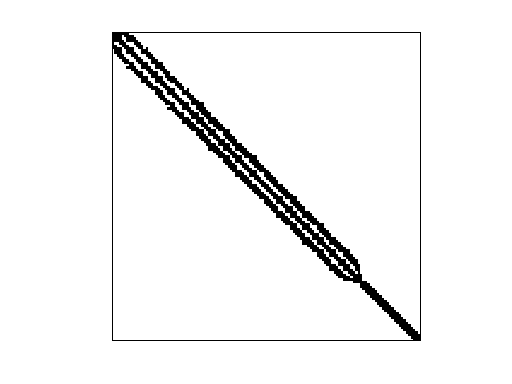
nonzero pattern of Li/li
| Ordering statistics: | result |
| nnz(chol(P*(A+A'+s*I)*P')) with AMD | 30,408,095 |
| Cholesky flop count | 7.9e+10 |
| nnz(L+U), no partial pivoting, with AMD | 60,793,495 |
| nnz(V) for QR, upper bound nnz(L) for LU, with COLAMD | 28,808,169 |
| nnz(R) for QR, upper bound nnz(U) for LU, with COLAMD | 49,884,385 |
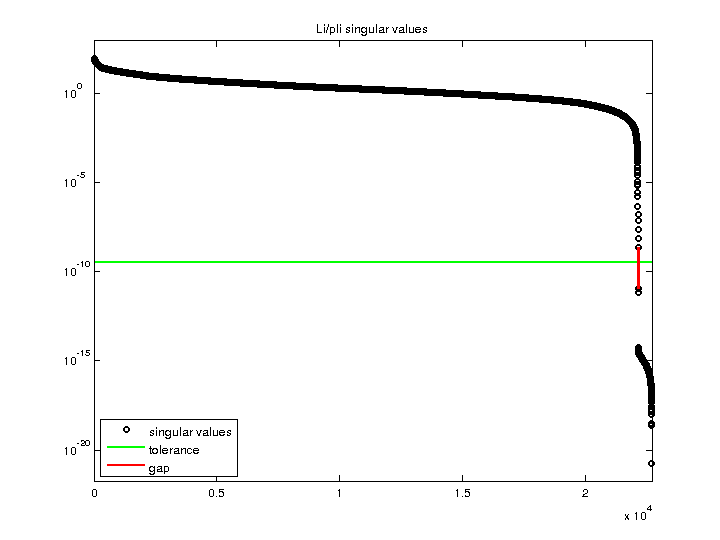
| SVD-based statistics: | |
| norm(A) | 83.7389 |
| min(svd(A)) | 1.86805e-21 |
| cond(A) | 4.48269e+22 |
| rank(A) | 22,131 |
| sprank(A)-rank(A) | 564 |
| null space dimension | 564 |
| full numerical rank? | no |
| singular value gap | 195.457 |
| singular values (MAT file): | click here |
| SVD method used: | s = svd (full (R)) ; where [~,R,E] = spqr (A) with droptol of zero |
| status: | ok |
For a description of the statistics displayed above, click here.
Maintained by Tim Davis, last updated 12-Mar-2014.
Matrix pictures by cspy, a MATLAB function in the CSparse package.
Matrix graphs by Yifan Hu, AT&T Labs Visualization Group.