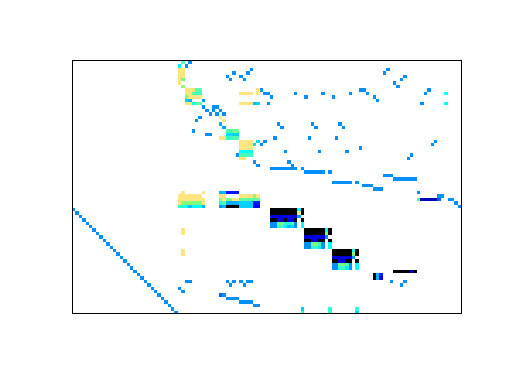
Matrix: LPnetlib/lp_blend
Description: Netlib LP problem blend: minimize c'*x, where Ax=b, lo<=x<=hi
|
| (bipartite graph drawing) |
 |
| Matrix properties | |
| number of rows | 74 |
| number of columns | 114 |
| nonzeros | 522 |
| structural full rank? | yes |
| structural rank | 74 |
| # of blocks from dmperm | 1 |
| # strongly connected comp. | 1 |
| explicit zero entries | 0 |
| nonzero pattern symmetry | 0% |
| numeric value symmetry | 0% |
| type | real |
| structure | rectangular |
| Cholesky candidate? | no |
| positive definite? | no |
| author | N. Gould |
| editor | D. Gay |
| date | 1989 |
| kind | linear programming problem |
| 2D/3D problem? | no |
| Additional fields | size and type |
| b | full 74-by-1 |
| c | full 114-by-1 |
| lo | full 114-by-1 |
| hi | full 114-by-1 |
| z0 | full 1-by-1 |
Notes:
A Netlib LP problem, in lp/data.  For more information
send email to netlib@ornl.gov with the message:

	 send index from lp
	 send readme from lp/data

The following are relevant excerpts from lp/data/readme (by David M. Gay):

The column and nonzero counts in the PROBLEM SUMMARY TABLE below exclude
slack and surplus columns and the right-hand side vector, but include
the cost row.  We have omitted other free rows and all but the first
right-hand side vector, as noted below.  The byte count is for the
MPS compressed file; it includes a newline character at the end of each
line.  These files start with a blank initial line intended to prevent
mail programs from discarding any of the data.  The BR column indicates
whether a problem has bounds or ranges:  B stands for "has bounds", R
for "has ranges".

The optimal value is from MINOS version 5.3 (of Sept. 1988)
running on a VAX with default options.

                       PROBLEM SUMMARY TABLE

Name       Rows   Cols   Nonzeros    Bytes  BR      Optimal Value
BLEND        75     83      521       3227       -3.0812149846E+01

Nick Gould supplied BLEND from the Harwell collection of LP test problems.

Concerning the problems he supplied, Nick Gould says that BLEND "is
a variant of the [oil refinery] problem in Murtagh's book (the
coefficients are different) which I understand John Reid obtained
from the people at NPL (Gill and Murray?); they were also the original
sources for the SC problems"

Added to Netlib on 6 April 1989
| Ordering statistics: | result |
| nnz(V) for QR, upper bound nnz(L) for LU, with COLAMD | 1,842 |
| nnz(R) for QR, upper bound nnz(U) for LU, with COLAMD | 1,177 |
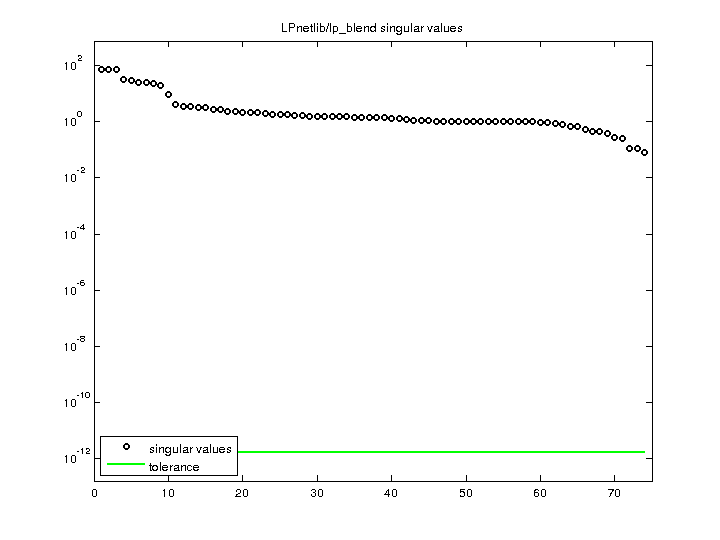
| SVD-based statistics: | |
| norm(A) | 74.6927 |
| min(svd(A)) | 0.0807637 |
| cond(A) | 924.831 |
| rank(A) | 74 |
| sprank(A)-rank(A) | 0 |
| null space dimension | 0 |
| full numerical rank? | yes |
| singular values (MAT file): | click here |
| SVD method used: | s = svd (full (A)) ; |
| status: | ok |
For a description of the statistics displayed above, click here.
Maintained by Tim Davis, last updated 12-Mar-2014.
Matrix pictures by cspy, a MATLAB function in the CSparse package.
Matrix graphs by Yifan Hu, AT&T Labs Visualization Group.