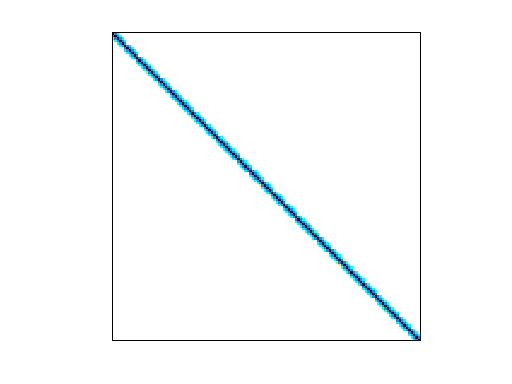
Matrix: GHS_psdef/wathen100
Description: Gould,Higham,Scott: matrix from Andy Wathen, Oxford Univ.
|
| (undirected graph drawing) |
 |
| Matrix properties | |
| number of rows | 30,401 |
| number of columns | 30,401 |
| nonzeros | 471,601 |
| structural full rank? | yes |
| structural rank | 30,401 |
| # of blocks from dmperm | 1 |
| # strongly connected comp. | 1 |
| explicit zero entries | 0 |
| nonzero pattern symmetry | symmetric |
| numeric value symmetry | symmetric |
| type | real |
| structure | symmetric |
| Cholesky candidate? | yes |
| positive definite? | yes |
| author | A. Wathen |
| editor | N. Gould, Y. Hu, J. Scott |
| date | 2004 |
| kind | random 2D/3D problem |
| 2D/3D problem? | yes |
Notes:
rand('state',0); A = gallery('wathen',100,100) ; % (in MATLAB)
| Ordering statistics: | result |
| nnz(chol(P*(A+A'+s*I)*P')) with AMD | 1,490,209 |
| Cholesky flop count | 1.9e+08 |
| nnz(L+U), no partial pivoting, with AMD | 2,950,017 |
| nnz(V) for QR, upper bound nnz(L) for LU, with COLAMD | 2,975,942 |
| nnz(R) for QR, upper bound nnz(U) for LU, with COLAMD | 7,068,015 |
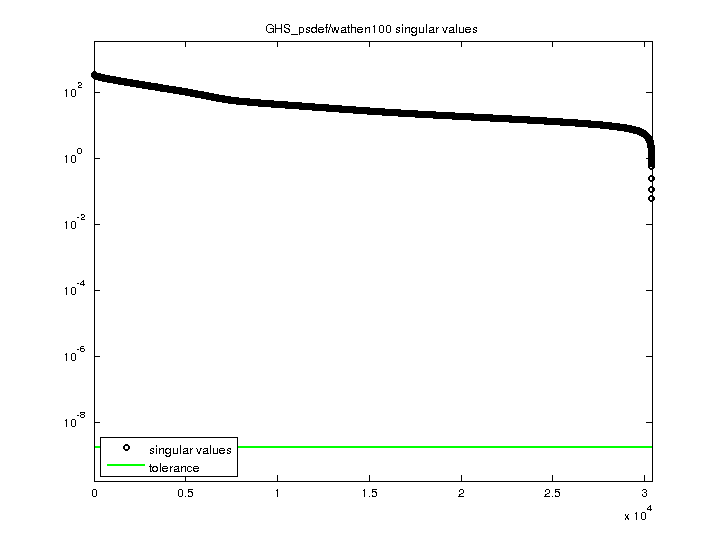
| SVD-based statistics: | |
| norm(A) | 369.674 |
| min(svd(A)) | 0.0635614 |
| cond(A) | 5816.01 |
| rank(A) | 30,401 |
| sprank(A)-rank(A) | 0 |
| null space dimension | 0 |
| full numerical rank? | yes |
| singular values (MAT file): | click here |
| SVD method used: | s = svd (full (A)) |
| status: | ok |
For a description of the statistics displayed above, click here.
Maintained by Tim Davis, last updated 12-Mar-2014.
Matrix pictures by cspy, a MATLAB function in the CSparse package.
Matrix graphs by Yifan Hu, AT&T Labs Visualization Group.